
Release Notes
Load Details Drill Through, new fuel and mileage metrics
A per-load drill-through below the load table, a fuel-recovery measure on Historical Charts, and new OR target and TMS mileage fields.
This release adds a new drill-through view for individual load detail, plus new cost and mileage metrics across Historical Charts, Price Opportunity, and Field Selection.
Highlights
- New Load Details Drill Through view surfaces per-load detail below the load table, with a one-click toggle back to the traditional full-table view.
- New Net Fuel Cost / Total CO Mile metric on Historical Charts isolates how much of rising diesel prices is being recovered through fuel surcharge versus absorbed.
- New OR Target LH / Billed Mi field on the Price Opportunity page.
- Two new mileage fields, Loaded TMS Miles and Loaded TMS Miles/Load, now available in Field Selection.
What's new
Load Details Drill Through
Four detail boxes sit below the load table and surface load-level detail without leaving the table view. With no individual load selected, the boxes show the average across every load currently in the table. Selecting an individual load swaps the boxes to that load's own details.
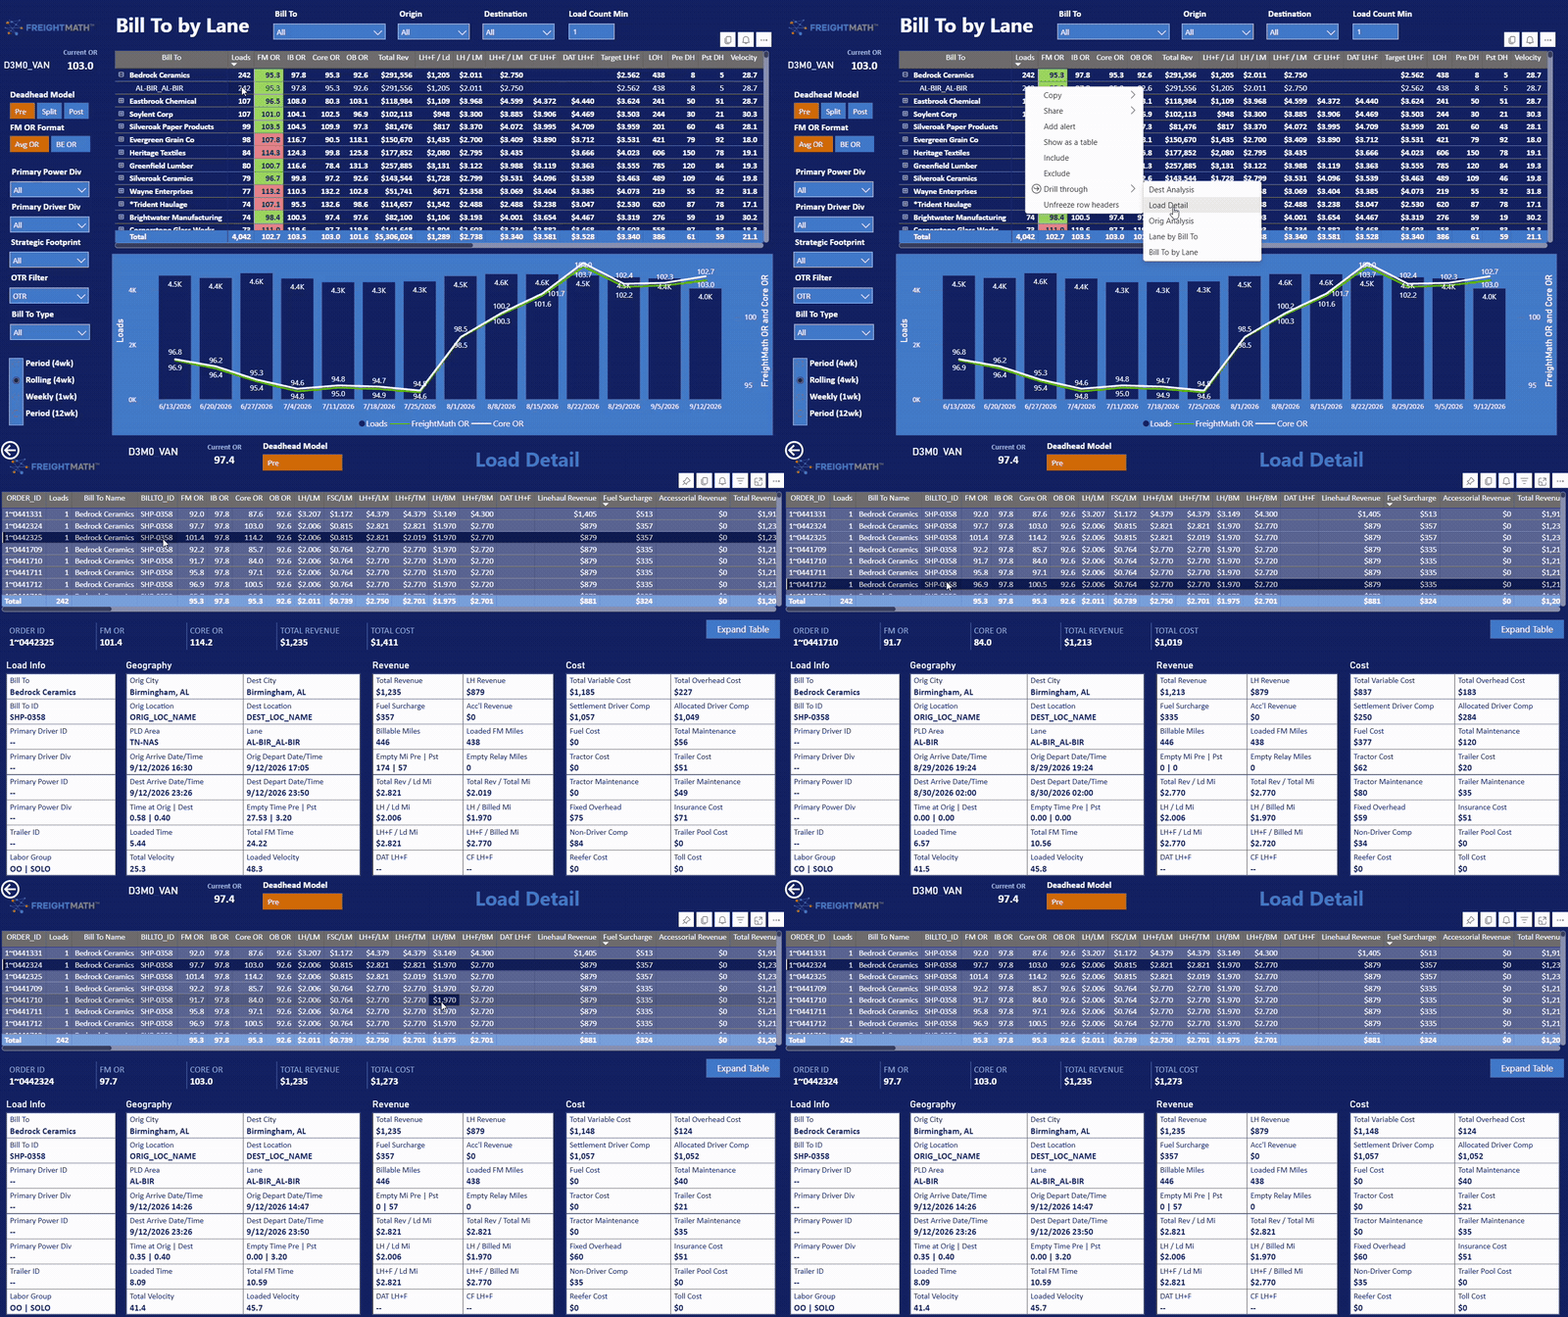
Select a load in the table to see its individual detail in the four boxes, or leave the selection empty to see the average across the table. Click Expand Table to hide the boxes and expand the table into the traditional full view; click Collapse Table to bring the boxes back.
Net Fuel Cost / Total CO Mile
With diesel prices climbing again this year, Historical Charts now trends Net Fuel Cost / Total CO Mile, calculated as (Fuel Cost - Company Fuel Surcharge) / Total Company Miles. Fuel surcharge is typically billed against loaded or billed miles, while diesel is burned across every company mile, including the empty and deadhead miles that never generate surcharge revenue. Netting fuel cost against fuel surcharge before dividing by total miles turns this into a recovery measure rather than a spend measure: it shows how much of the current run-up in diesel prices is actually being recovered versus absorbed.
Watch this line during periods of rising diesel prices or heavy deadhead. A rising trend signals a fuel surcharge schedule or fuel-purchasing program that needs a second look before the erosion shows up in OR.
Improvements
- Price Opportunity: Added OR Target LH / Billed Mi.
- Field Selection: Added Loaded TMS Miles and Loaded TMS Miles/Load.
Fixes
None reported this week.
In development
- Spot Check and Trip Check — the two apps are targeted for deployment on October 6.
- API access — currently in beta.
- Reimagined benchmarking dashboards — a rebuild of the benchmarking views in MapLedger.