Methodology & Reference
FreightMath Dashboard
A reference for every page in the FreightMath Dashboard — what it shows, how to use it, and how segment-level costing powers the underlying analytics.
The Deadhead Model Slicer
Every page in the FreightMath Dashboard includes a Deadhead Model slicer that controls how empty (deadhead) segment costs are attributed to orders. The choice does not change total network cost — it changes which order absorbs the empty miles and hours, which directly affects load-level OR and lane profitability rankings. Choose the model that best reflects your network's accountability philosophy.
PRE
Empty miles before pickup are attributed to the next order loaded. Treats empty as the “cost of acquiring” the next load.
POST
Empty miles after delivery are attributed to the prior order delivered. Treats empty as the “cost of leaving” after completion.
SPLIT (50/50)
Empty costs are shared equally between the preceding and following order. Balances attribution across the network.
How each model assigns empty cost
Switch between the three models to see how the same two empty segments land on Order A and Order B.
Dashboard Pages
Select any page below to see a description and preview. Pages marked with SLC have direct connections to the segment-level cost allocation engine.
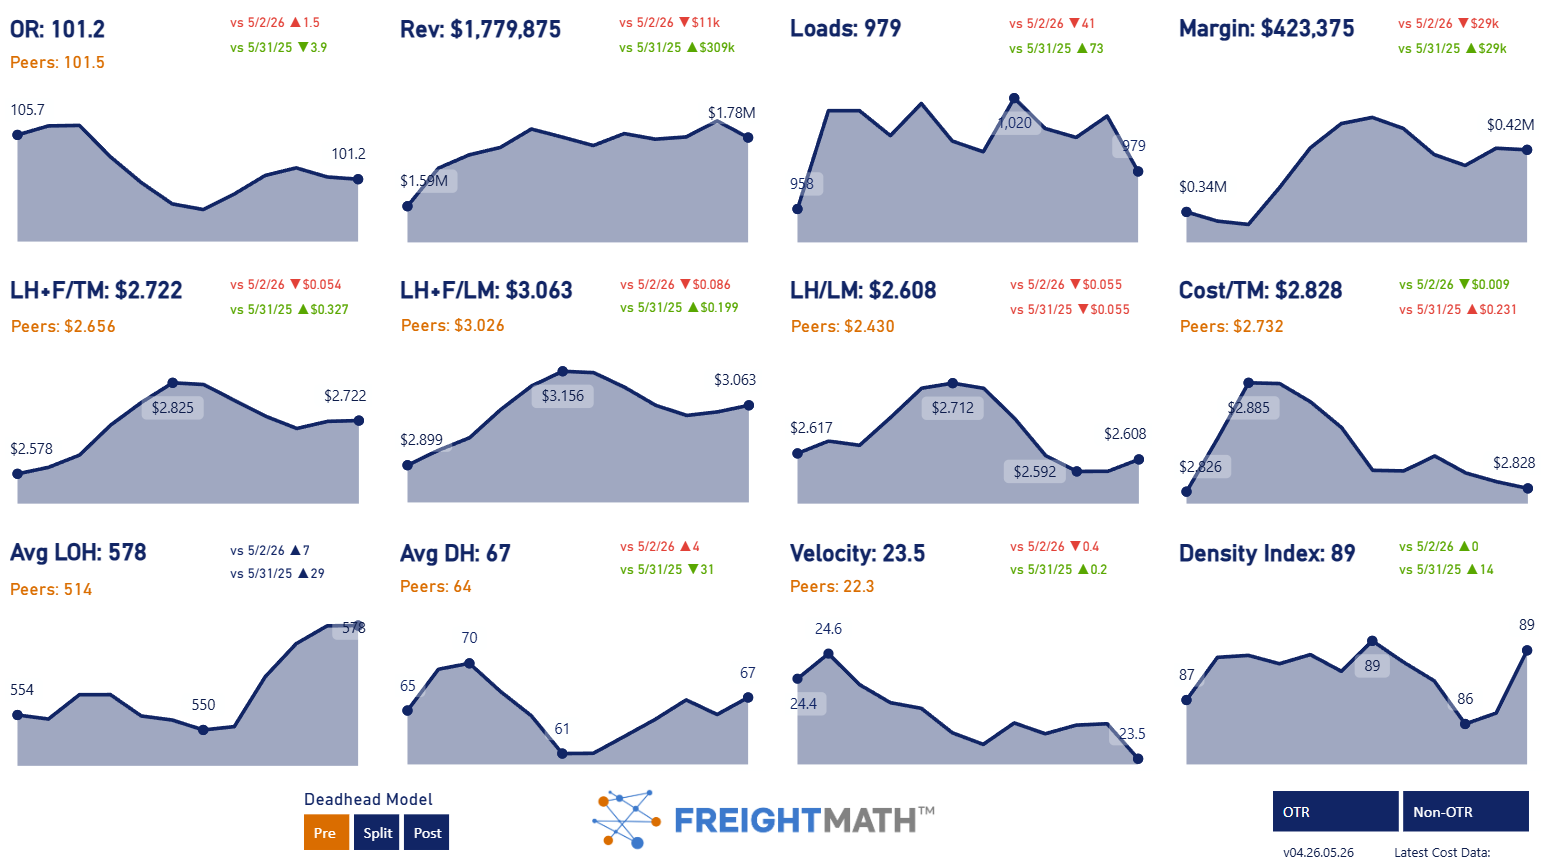
This is the first page FreightMath clients see when they log into their respective portals. It provides a high-level overview of the health of the operation.
Key statistics:
- Operating Ratio, Load Volume, Revenue, and Margin
- Rate trends — both revenue and total allocated cost per mile
- Network operational attributes: Deadhead (absolute miles), Density, and Velocity
These bottom-row metrics have a direct influence on network profitability and serve as leading indicators for operational efficiency.
FreightMath Dashboard · KSM Transport Advisors · Dashboard guide reflects current production release.