
Office Hours
Office Hours Recap: November 13, 2026
Three demos in one hour — the new web dashboard, the Dedicated Advanced Tool end to end, and what shipped recently in BidRight.
A long session, and most of it was spent on screen rather than on slides. Below is what we showed, with clips from the recording. If you want any of it walked through on your own data, your engagement team can do that any time.
1. The web dashboard that replaces Power BI
Still early, demoed on a sample carrier account. The goal is feature parity with Power BI before it goes any wider, and several pages already go past it.
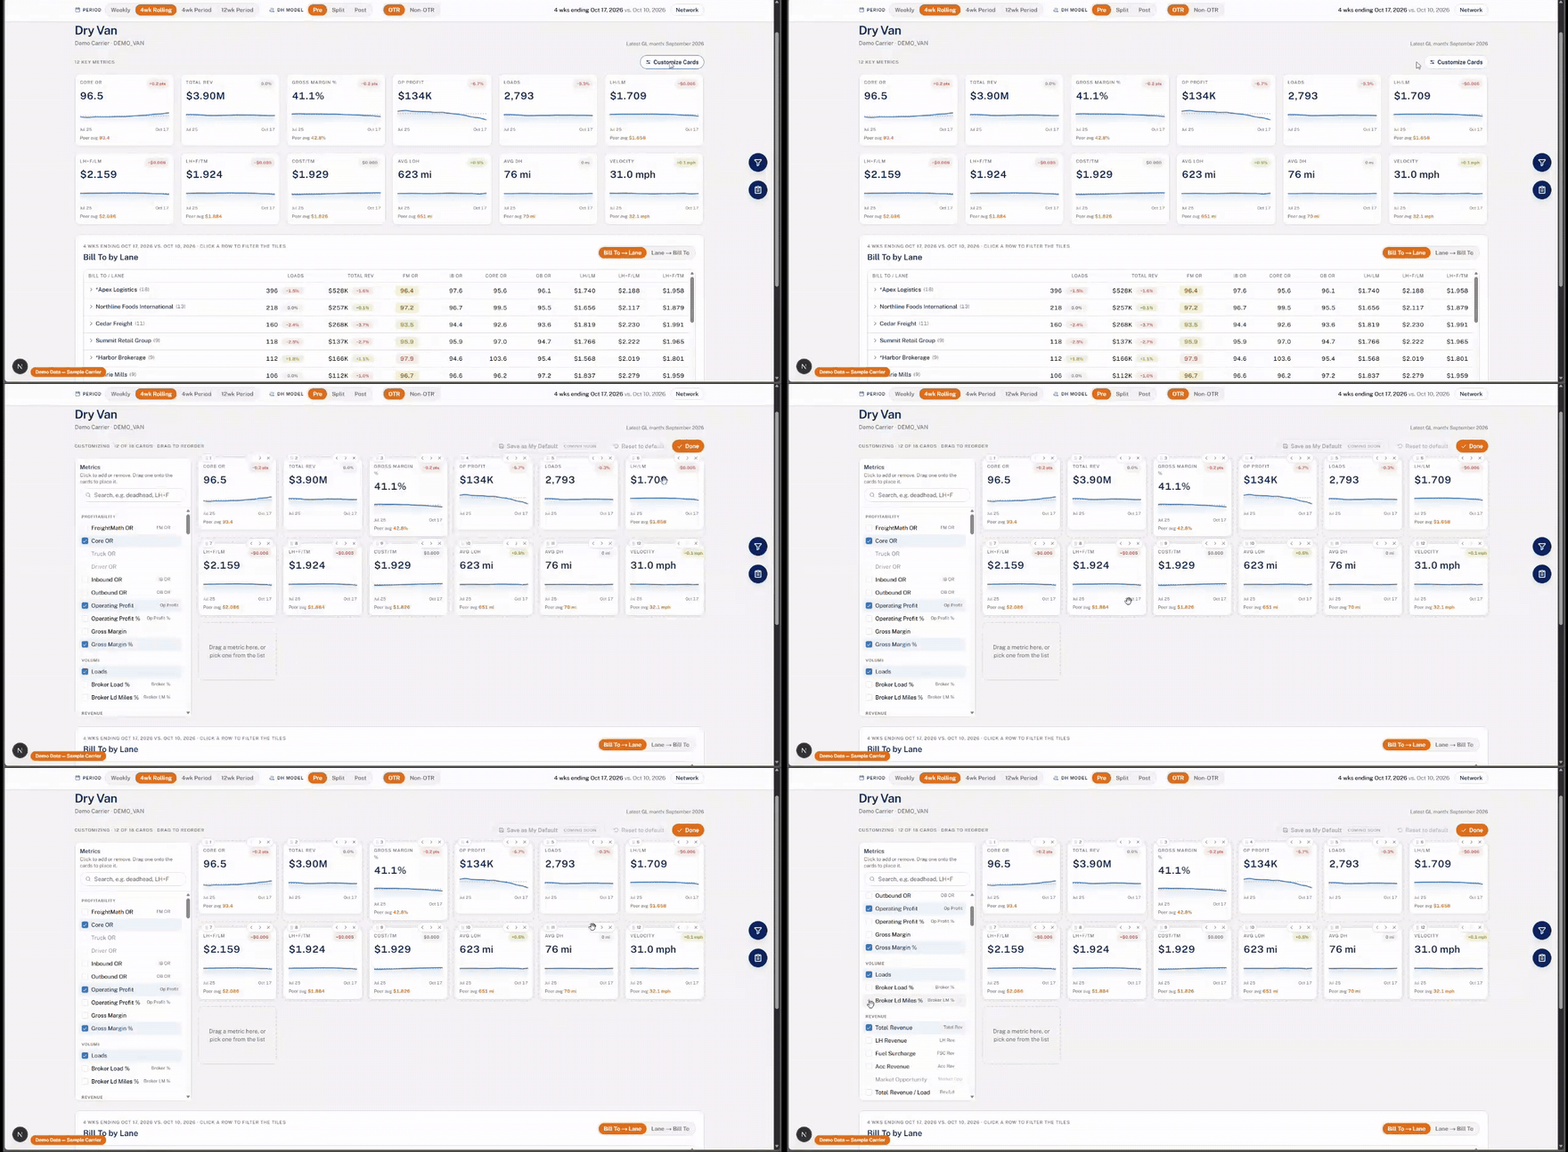
A home page you build
Twelve metric cards, chosen and ordered through the Customize Cards button, then saved as your default. Power BI could not do this. The weekly data refresh email will carry a snapshot of whatever you saved, so the email matches your own view instead of a generic one.
Charts that answer a specific question
Historical Charts takes a primary and a secondary y axis, a custom date range, and an index mode that rebases every selected measure to the first period, so two measures on different scales can be compared as movement. In the demo range, Core OR was up 0.3 percent while linehaul plus fuel per total mile was up 1.1 percent.
Areas of Profit, redrawn
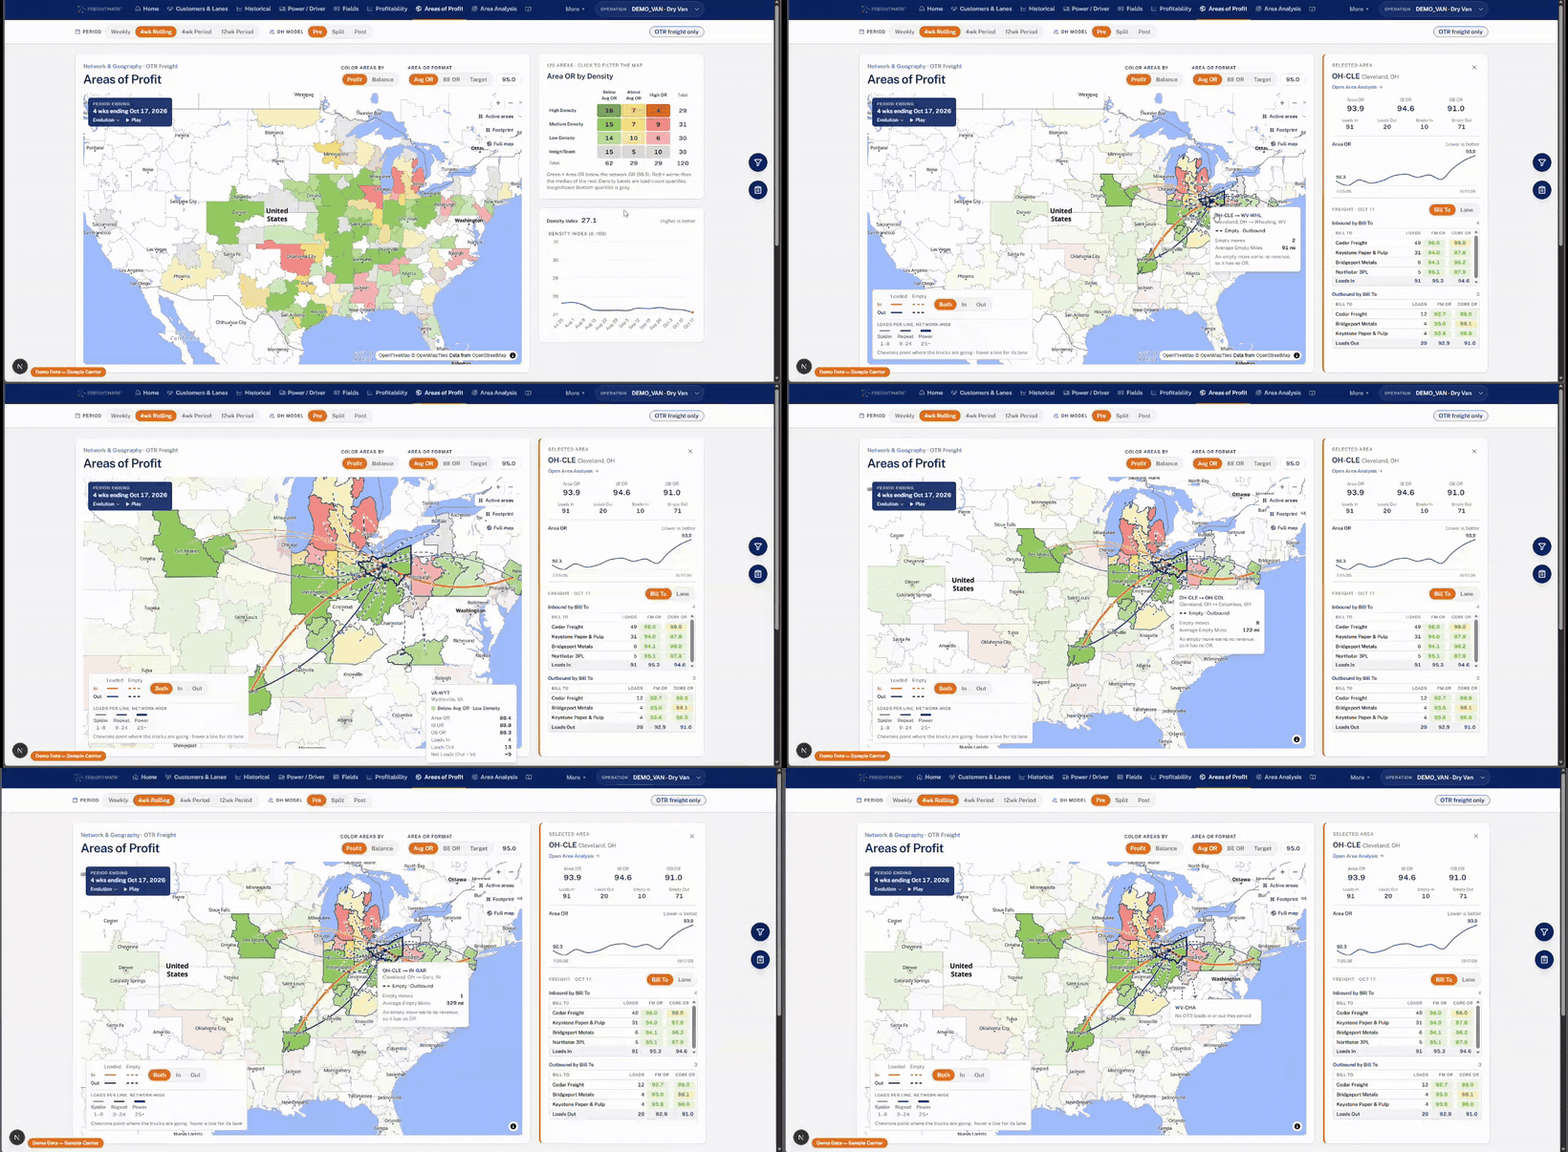
Inbound lanes read as orange lines, outbound as blue, and empty moves as hash marks, so a map that used to need explaining now reads at a glance. Click an area and the sidebar gives you area OR, inbound and outbound OR, truck origin and destination, the trend, and the inbound and outbound split by bill to or by lane.
Open Area Analysis
A new drill through that opens a page filtered to one area: inbound OR, outbound OR, loads in and out, bill to and lane breakdowns, actual pickup and delivery locations plotted on the map, and a balance by day table showing which days of the week your loads pile up on. Load context for surrounding areas is coming to the same page and was not in the demo build.
Also shown
A field selection page that mirrors the Power BI table builder and exports straight to Excel. A deadhead model that defaults to your existing backend setting, can be overridden per screen, and toggles between OTR only, non-OTR only, and both combined, which matters for mixed fleets. Customers and Lanes now consolidates bill to by lane, lane by bill to, revenue volume change, and pricing analysis onto one page, with the long requested city to city drill down on the way. An expanded filter pane is planned to replace the old left hand column. Comparing two periods you pick, rather than current against previous, is on the roadmap.
More scenarios, better usability, and a bid award sandbox where you model new volume either as an add on or as a replacement for an account you already have, plus rate change modeling.
2. The Dedicated Advanced Tool, start to signed contract
Live now at app.freightmath.com. We walked a preloaded sample deal that pairs a regional fleet out of Indianapolis with a local fleet in Brownsburg, Indiana, which is the kind of split most dedicated opportunities actually arrive as.
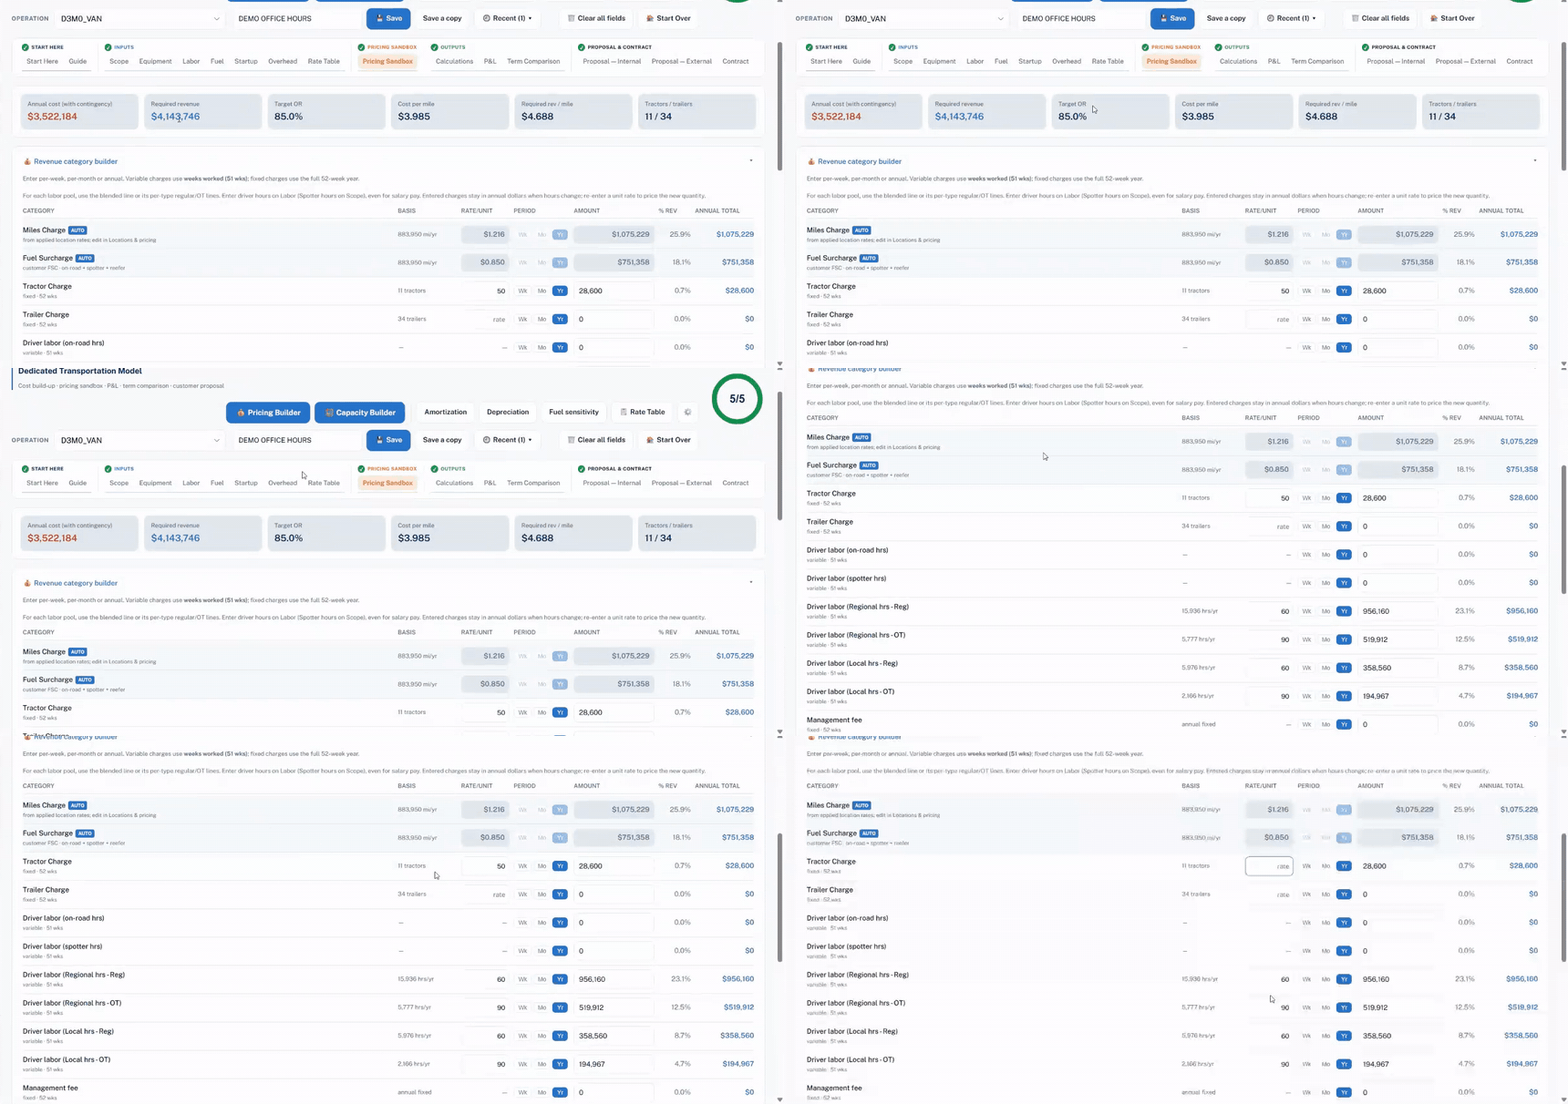
The sandbox solves for the rate
Enter the cost structure and it back solves the base mileage rate that hits your target OR. In the demo, $3.5 million of cost needed $4.14 million of revenue to land an 85 target OR, opening at $3.60 a mile of linehaul plus $0.85 a mile of fuel surcharge.
Every category you bill separately pulls the mileage rate down
Add trailer rental at $125 a week across 34 dry vans, about $221,000 billed, and the mileage charge drops to match. Add hourly driver rates on top and the variable mileage rate fell to $0.93 a mile. Revenue share, toll pass throughs, and fuel and DEF pass throughs all calculate the same way, including the carrier side split of anticipated revenue, $149,000 in the demo.
Then it writes the deal up
A calculations page gives you revenue and cost by category as a sanity check, with jump links into any section you want to edit. An internal P&L view summarizes profitability. A term comparison page models multi year profitability under general inflation against a CPI capped contract increase, and in the demo the gap between a 4 percent inflation assumption and a 3 percent cap had eroded most of the margin by year three. The external proposal is built from the same inputs as a single page showing scope, annual charges by category, and year by year projections, with toggles to hide the projection table or the rate increase line. Both the internal summary and the shipper facing proposal save, export as PDF, or download as Word.
A draft contract, assembled from your selections
The generator reads what you chose throughout the tool, revenue share, parking, scope and the rest, and assembles the matching paragraphs. Anything still blank is highlighted in orange so it cannot slip through, and you can export to Word to strip the sections that do not apply.
3. BidRight, and one thing worth checking today
Jordan walked the recent BidRight releases. The ones that shipped this past week are in the Release Notes; what follows is the rest of what he showed.
Lane context now carries your own pricing history
Click a lane inside a bid and a pop-up gives you that lane across every bid you have submitted before, the rates you put up and whether it was awarded. You stop pricing a lane as though you have never seen it. Dashboard data is going into the same pop-up next, volume trends, average deadhead, which of your customers already run the lane, and market carrier highs and lows, so the context arrives without switching tools.
Pricing toward modeled OR is still the default we recommend
Core OR pricing is now available as an alternative, and it back calculates the rate a lane needs to clear a specific standalone margin. Use it where a lane genuinely has to stand on its own. For everything else, modeled OR is the number that accounts for what the lane does to the network around it.
Two new columns
An oversized class for flatbed carriers, and a dedicated stop-off column for trailer pool or intermediate stop information. Both used to live in notes or requirements fields, where nothing could price off them.
Smaller things that add up over a long pricing session
A full-screen button at the top right hides the left toolbar so more lanes fit on screen. Per-lane actions now sit behind a hover ellipsis or a right-click: auto-rate that one lane, recalculate its S-rates, or delete it, without regenerating every lane you have marked for interest.
The $7.00 DOE peg was added to company settings and to individual bids, and BidRight auto populated it for existing bids that already had a peg and a miles per hour section. Auto population is not the same as correct. Open your active bids and confirm the peg is not sitting at zero.
Trailer pool costs
Not yet a dedicated line item. The near term answer is likely a general upcharge field, with a proper trailer pool cost module as a longer term addition. We are getting a timeline from the BidRight team and will report it here.
Next session
The most useful hours start with a client sharing their own dashboard and asking why a number looks the way it does.