
Release Notes
Price Opportunity, Profit on the Home Page, and new Benchmark Capabilities
A rebuilt price-centric page that prices to an OR you choose, a Profit tile on Home, peer benchmarks you can see into, and a consolidated MapLedger Review.
Most of this release landed in the FreightMath Dashboard, led by a rebuilt pricing page. MapLedger gained two ways to see more at once: a consolidated Review, and a benchmark that opens up to show the pool behind it.
Highlights
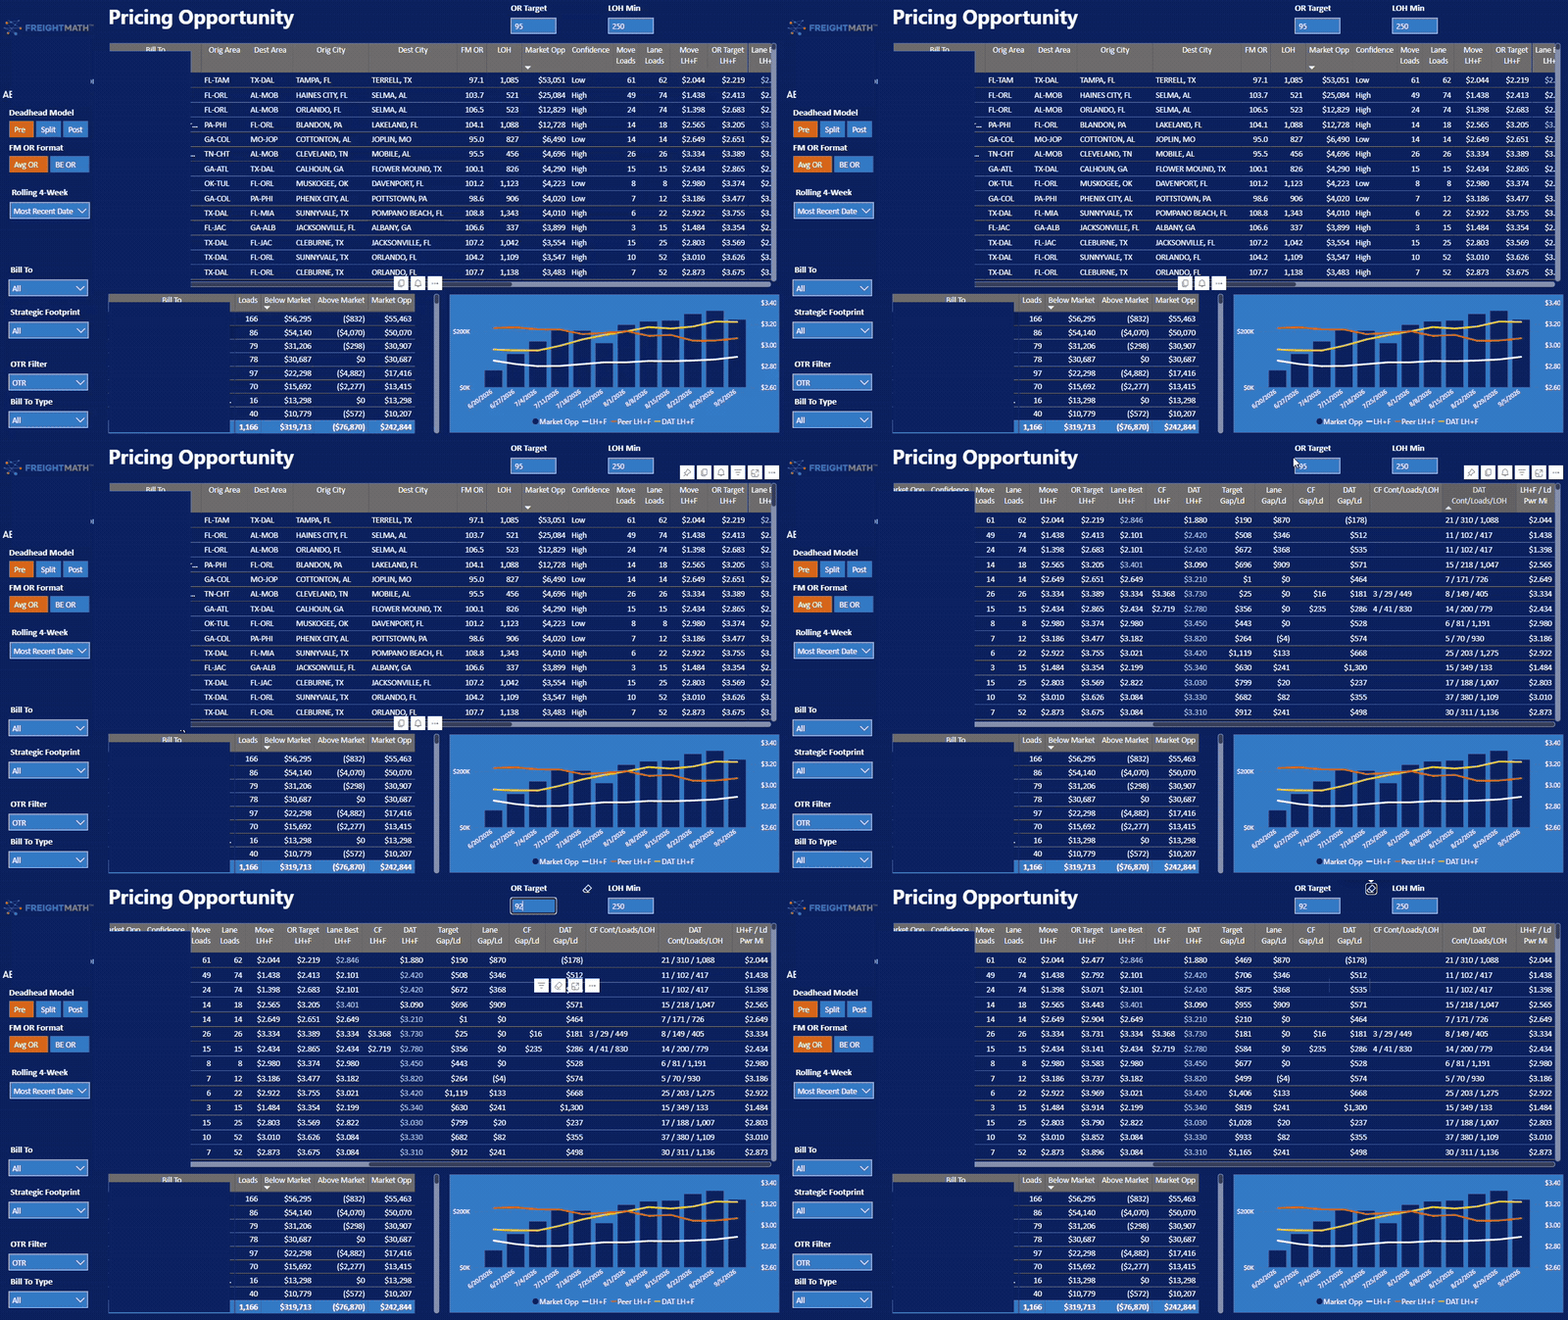
- Price Impact is now Price Opportunity — set your own OR target, benchmark against Lane Best instead of Lane Avg, and see a confidence level on every row.
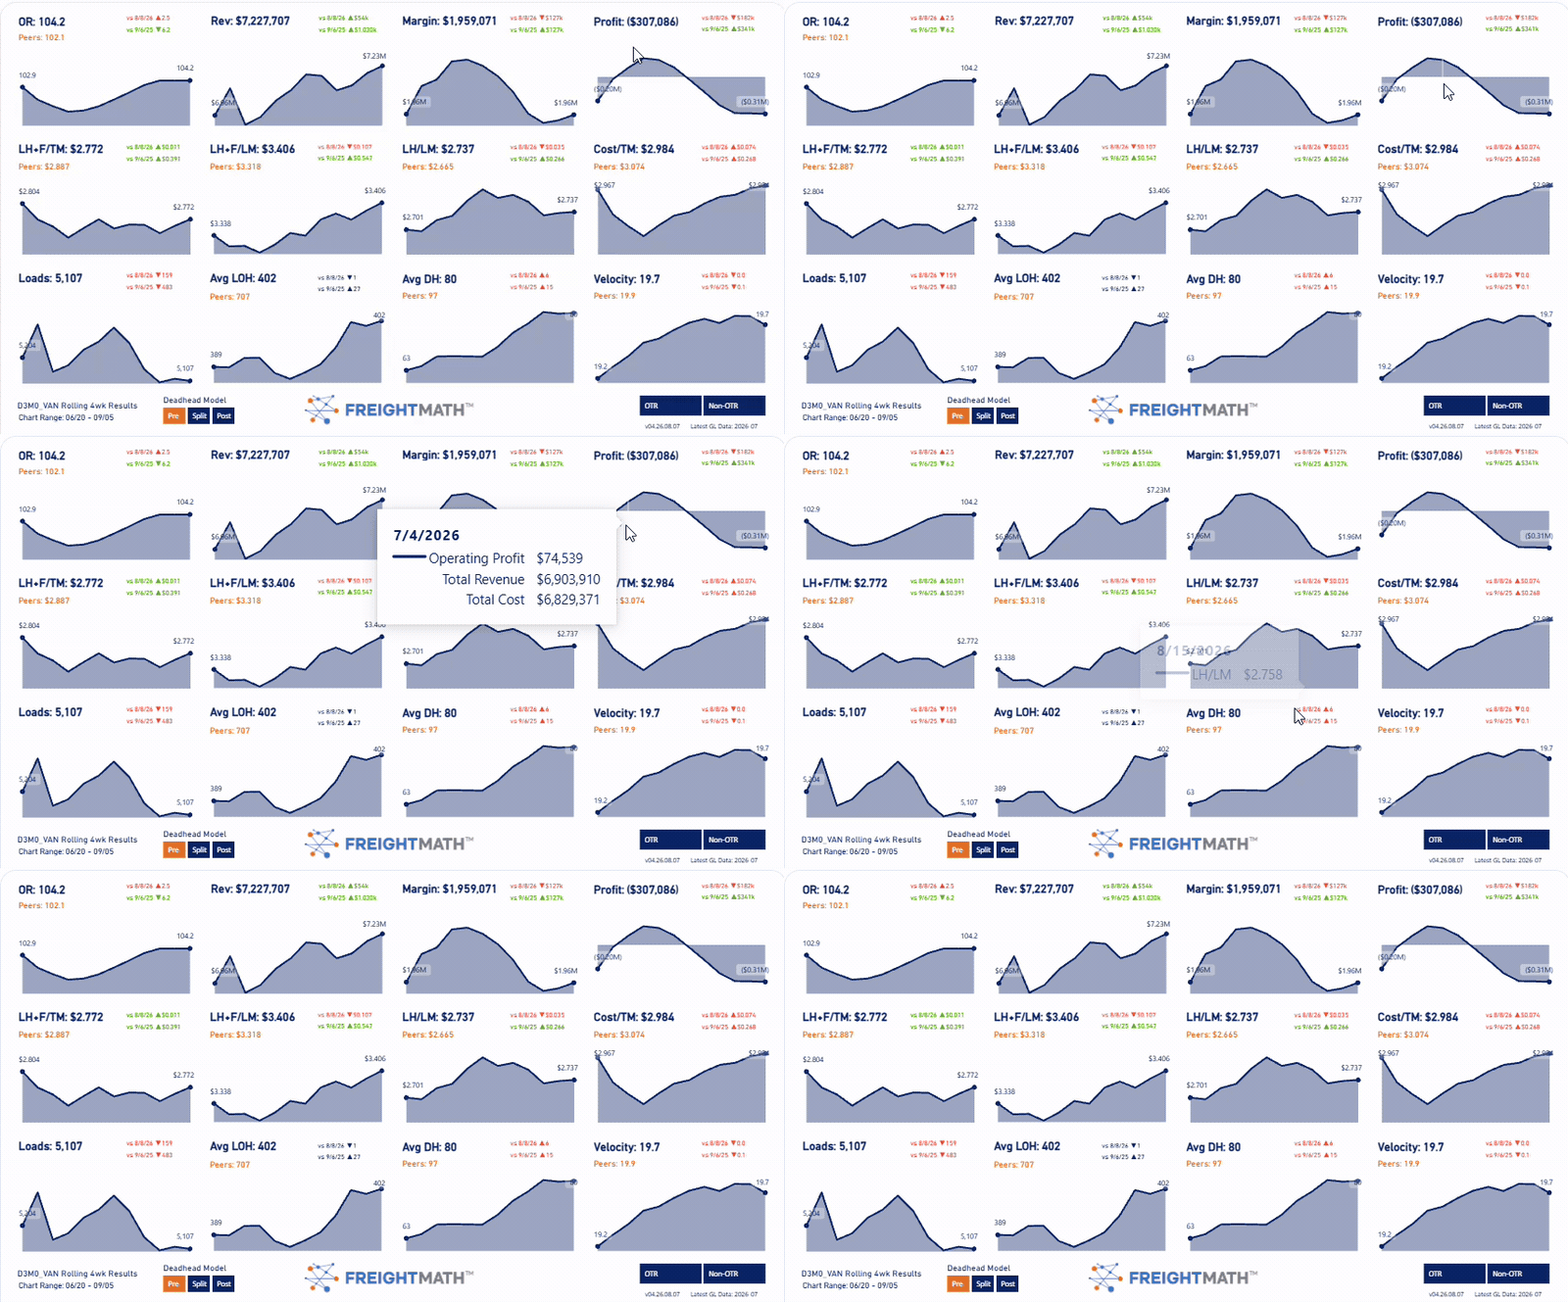
- Profit on the Home page — a fourth KPI tile puts operating profit next to OR, Revenue, and Margin.
- Division on pricing pages — Power and Driver Division slicers reach Bill To by Lane and Lane by Bill To.
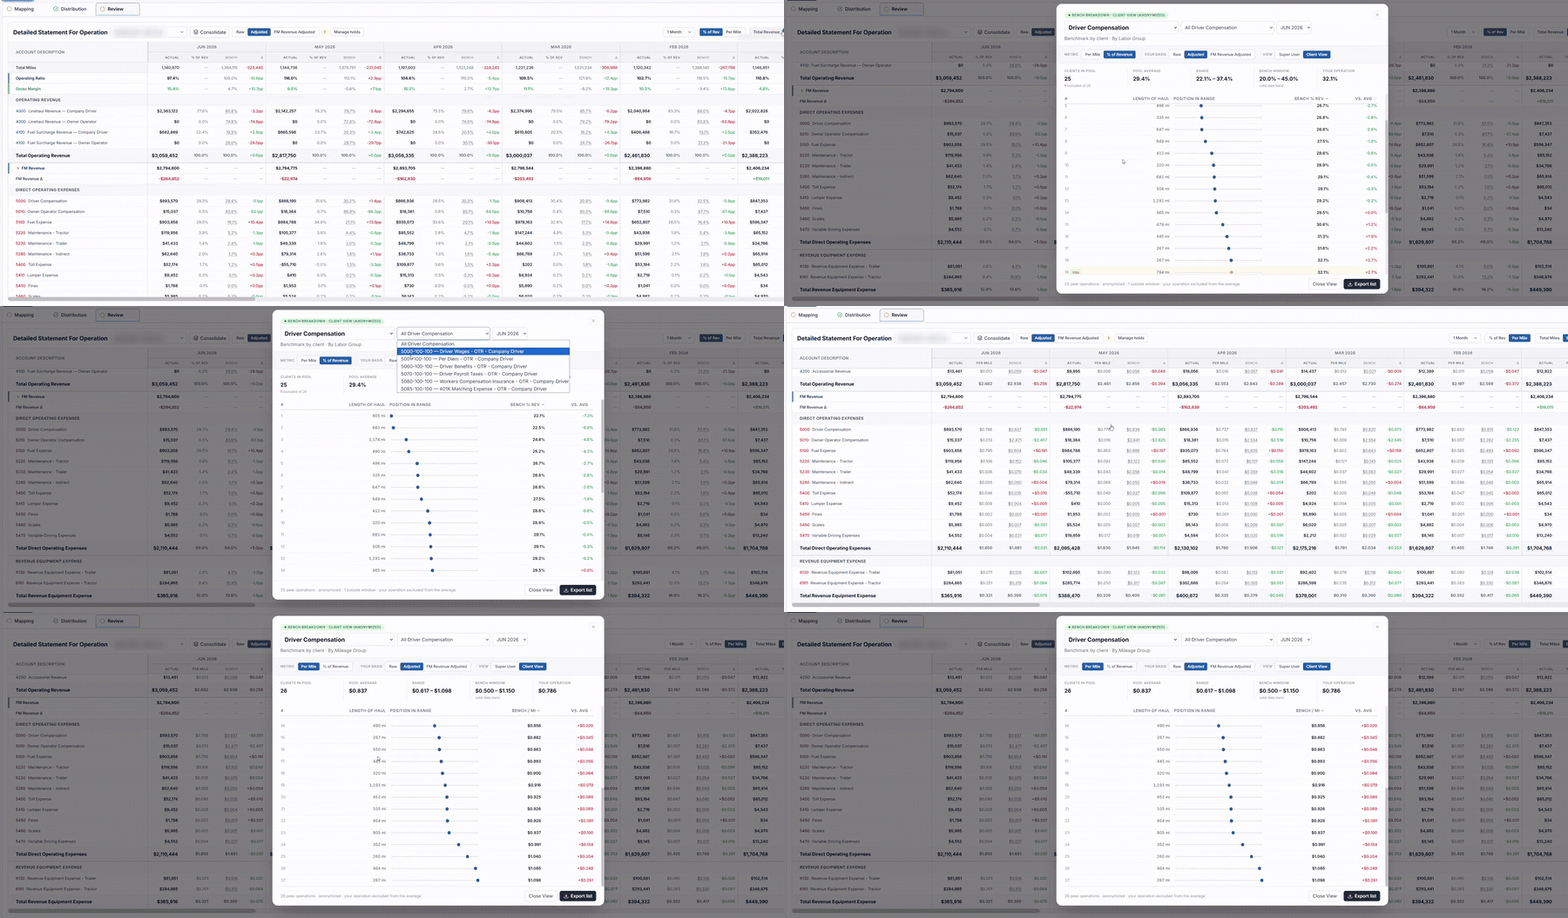
- Benchmark Breakdown — click any FreightMarks bench value in MapLedger and see the anonymized pool behind it.
- Consolidated Review — roll several MapLedger operations into a single Detailed Statement.
What's new
Price Opportunity
The rename follows a change in what the page does. The old Price Impact page told you where a move sat against a lane average and a DAT reference. The new one prices to an OR you choose, benchmarks against the best the lane has produced rather than the middle of it, and tells you how much to trust every row.
Set your own OR target. A new OR Target slicer picks the OR you are pricing to, and OR Target LH+F recalculates to the linehaul plus fuel rate per mile that gets you there. Price to budget, to where the network sits today, or to where you need it next year.
Lane Best replaces Lane Avg. The average tells you what you usually get on a lane. Lane Best LH+F tells you what the lane has already proven it will pay.
A Confidence level on every row. Each move is scored against three independent references: Lane Best LH+F, your own proven ceiling; Carrier First, the rate index across all current FreightMath clients; and DAT. Two or more above the Move LH+F is High. One above and none below is Medium. One above with one or more below is Low.
Net the opportunity. New Below Market, Above Market, and Market Opp (net) fields separate the freight you are underpricing from the freight you are overpricing, then net the two. A renewal conversation starts from a net position instead of a one-sided list.
Sizing a pricing gap was never the hard part. Knowing which half of it is real is. Pushing the High rows and leaving the Low ones alone is a different bid posture than chasing every gap on the page.
Profit on the Home page
A fourth tile puts operating profit — revenue less all allocated cost including overhead — next to OR, Revenue, and Margin. Margin is gross profit, before overhead. Profit is the dollar answer to the OR tile at the far left of the same row, and the trend shades above and below a zero line, so a network that crossed from making money to losing it shows the crossing instead of just a falling line.
Power and Driver Division on pricing pages
Costing by division is not new. What is new is that the division dimension now reaches the pages where customer and lane decisions get made. Primary Power Division and Primary Driver Division are slicers on both Bill To by Lane and Lane by Bill To, so a multi-division carrier stops reading a company-wide blend on the pages that drive pricing. Power/Driver by Segment gained division summary buttons, and the Truck OR and Driver OR definitions now sit in the table title info buttons.
New peer measures
Three peer series per power unit — Peer Total Revenue, Peer Total Miles, and Peer Loaded Miles — so revenue and utilization per truck trend against the pool rather than against your own history alone. That is the comparison that tells you whether a soft quarter was yours or everyone's. Fuel Cost / Total CO Mile was added alongside them, keeping the ratio honest on a mixed fleet. Every cost measure is now available in Value Selection.
Benchmark Breakdown
Until now the FreightMarks bench on the Detailed Statement was a single number. Click any bench value and MapLedger opens a client-safe, anonymized view of the pool that produced it: how many clients are in it, the pool average, the range, the bench window, and where you sit. One row per peer operation shows length of haul, position in the range, the bench value, and variance to the average, with your own operation marked. Drill from a rolled-up account such as Driver Compensation into its Standard Chart of Accounts children, switch months, toggle per mile or percent of revenue, and export the anonymized list.
Consolidated Review
The Review tab has always shown one operation at a time, which is right when you are validating a mapping and wrong when somebody asks how the company did. Consolidate now rolls several operations into a single Detailed Statement — same columns, same bases, same accounts. For a carrier running separate van, refrigerated, or regional operations, the combined position is now something you read rather than something you assemble in a spreadsheet.
Improvements
- Excel-like filters on every column in MapLedger. The Mapping and Distribution tabs now filter the way a spreadsheet does, and filters stack across columns.
- Manage Holds stops reloading. Switching operations inside Manage Holds now switches in place instead of dropping you back at the top.
Fixes
- Dynamic distribution presets no longer create themselves. A bug was generating presets automatically, leaving entries in the list nobody had set up.
- GL auto-ingest from blob storage. The process that imports client GLs directly from blob storage into MapLedger is working again.
In development
Spot Check and Trip Check are being re-imagined as full applications hosted within the new FreightMath app. Spot Check prices a single load against your own cost structure, reasoning on FMOR2 — the composite of Core OR and Outbound OR that leaves Inbound OR out — because when the tractor is already sitting at the origin the inbound leg is a sunk position. Trip Check extends that logic across a full trip. Also underway: Cohorts, narrower peer groups inside a benchmark pool, so a bench can be drawn against the operations you actually consider comparable.