
FreightMath

FreightMath unifies your general ledger with your TMS — distributing every dollar of cost down to the individual load using the real activity that drove it: miles run, hours under power, and load-specific charges. The result is load-, lane-, customer-, and network-level profitability that reflects operational reality, not accounting approximations.

Your Data
Your General Ledger
Costs, mapped by MapLedger
Your TMS
Loads, miles & hours — McLeod, TMW, Alvys & more
Load-Level Costing
Five allocation methods assign every dollar
Operating Ratio
True profit by load, lane, customer & network

See exactly where margin is made — and where it’s lost — load by load.

It Starts With Credible Data

Allocating costs and measuring true profitability in a truckload network is a complex exercise. Carriers must start with credible data and practical logic — but most TMS data looks like the left column. Watch FreightMath clean it.

Your TMS Data
FreightMath Cleaned
Load #4892 — OKC → MEM
Pickup: 03/15 02:00 AM
Delivery: 03/15 01:30 AM
Delivery BEFORE pickup — negative transit time
Corrected with FreightMath Continuity Logic
Pickup: 03/15 06:12 AM
Delivery: 03/15 02:47 PM
8.6 hrs transit • 462 mi • accurate cost allocation
Truck #287 — 03/12 to 03/14
Seg 1: DAL → OKC (loaded)
Seg 2: ??? — 22 hrs unaccounted
Seg 3: OKC → MEM (loaded)
Missing segment — where was the truck for 22 hours?
Gap reconstructed
Seg 1: DAL → OKC (loaded)
Seg 2: OKC yard dwell — 14 hrs
Seg 3: OKC → shipper — 38 mi DH
Seg 4: OKC → MEM (loaded)
Every hour & mile accounted for
Load #5201 — ATL → JAX
Truck: #104, #287, #104
Driver: Martinez, —, Johnson
Two trucks on one load — TMS re-assignment artifacts
Resolved to actual asset
Truck: #104 (confirmed)
Driver: Martinez (full trip)
Single asset • accurate driver cost • clean linehaul
Truck #104 — 03/18
Empty mi: 347 miles deadhead
Origin: MEM → DAL (no load)
Phantom deadhead — truck was actually loaded (wrong status code)
Matched to load #5318
Status: Loaded (revenue move)
Revenue: $812.40 recovered
347 “empty” miles reclassified • OR drops 2.1 pts

Click each row to clean the data — 0 of 4 resolved

Learn More About FreightMath Data Specs

From GL Data to Load-Level Profitability

Every carrier’s General Ledger is unique. FreightMath maps it to a common standard, then distributes costs to every load.

Acct 5100 — Fuel Expense Acct 6200 — Driver Settlements Acct 6500 — Insurance Premiums Acct 5400 — Repairs & Maint Acct 5300 — Tolls & Permits Acct 7100 — Admin & Overhead Acct 6300 — Benefits & Tax Acct 5200 — Depreciation
FreightMath Standard Chart of Accounts
Driver Compensation
Fuel
Equipment Expense
Maintenance
Insurance
Direct Onroad Expense
Overhead
Admin
Distribute to Loads

Variable Costs

Loaded 65% · Empty 35%

Proportional share of empty & loaded miles

Overhead

Loads · Empty · Dwell

Distributed by loads, empty & dwell hours

Pre-Standard

✓ Driver Settlements
✓ Direct Charges
✓ Equipment Costs

Specific costs allocated directly to each load

Toll Costs

Near-Time Validated

Direct & accurate toll costs, validated in near-time

Trailer Pool

Dedicated trailer pool costing model

Load 1
Load 2
Load 3
Load 4
Load 5
Load 6
Load n

How FreightMath OR Is Calculated

Loaded Empty Inbound Outbound Empty Repo
Interactive Cost Model
802
160
20
1.3
1.3
Revenue$2.77/mi$2,222
Variable$1.67/mi−$1,607
Fixed$28.86/hr × 22.6h−$652
Total Cost$2,184
Cost / Mile$2.27
Core OR98.3
Core OR 95.0 One-way Profitability
Inbound OR 98.2 Cost to Enter Origin
Outbound OR 92.5 Value of Exiting Dest
FreightMath OR 94.8 Total Network Contribution

The Lower Rate Is the Better Lane

Every lane in a bid carries a Modeled OR built from your cost per mile and cost per hour — the same FreightMath costs you just saw, applied at the moment of the bid. A higher rate and a better lane stop looking like the same thing.

Peoria, IL → Indianapolis, IN
210 miles • live unload • truck is back the next day
$3.10per mile
$651 per load
Modeled OR97
100 = breakeven
Truck lands in Indianapolis. Outbound OR from there: 104
Peoria, IL → Columbus, OH
350 miles • drop and hook • reloads the same day
$2.75per mile
$963 per load
Modeled OR89
100 = breakeven
Truck lands in Columbus. Outbound OR from there: 88
35¢ less per mile — and the better lane.
You set the rateModeled OR
$2.70 per mile96
$2.85 per mile91
$3.00 per mile86
Or set the ORRate you need
Target OR 90$2.88 per mile

Works both directions. Change the rate and the OR moves with it. Set the OR you want and BidRight returns the rate.

Modeled OR tells you where you stand — you decide the bid. It runs on your cost per mile and cost per hour through FreightMath, built from your General Ledger, not a market average. A quick turn out of a strong market shows up as what it is: more money than the higher rate.

Replacescarrier conversations, 2026
  • “A higher rate doesn’t mean a better OR. Try explaining that.”
  • “Twenty percent margin on the round trip — if the perfect backhaul shows up.”
  • “That commitment looked good six months ago. Nothing told us it wasn’t anymore.”

Price One Number. Stop Giving Away Pennies.

Enter one standardized rate per mile. BidRight carries the fuel gap, the short miles, and the pay terms into the number the shipper sees — so the money you meant to charge is the money you actually collect.

$2.85
Your rate per mile. The only number you think about.
+
$0.03
Fuel gap. Their surcharge pays 61¢, yours expects 64¢.
+
$0.09
Short miles. They bill 480, the truck runs 495.
+
$0.03
Pay terms. 60 days instead of 30.
=
$3.00
What the shipper sees. Same money in your pocket.
Modeled OR at $3.00: 91 Minimum charge: $1,250 per load Maximum rate: $5.00 per mile

Every adjustment stays traceable on the lane, so sales can tell the shipper exactly why the rate is what it is — and exactly what it is paying for.

Replacescarrier conversations, 2026
  • “Fuel? It’s gut feel when he’s doing it.”
  • “I figure the carrying cost by hand, and I don’t lay it out for them.”
  • “Same customer, same cities, different rates. It costs us the same.”

Cut the Bid Cycle From Hours to Minutes

One file in, rates out in the shipper’s original format. No VLOOKUPs, no re-keying, no second system.

The old wayeight steps, most of them in Excel
Download the RFP
Convert to your template
Run miles
Run a pricing study
Price in Excel
Email it for review
Paste rates back in
Upload to the portal
Hoursor days on a big RFP
In BidRightone place, start to finish
Drop the file in
Mark the lanes you want
Auto Rate, then adjust
Export to the shipper’s file
Minutesper bid
10,000 lanes import in about a minute, with miles, tolls, and your history attached.
One click writes rates, capacity, and transit days back into the shipper’s own file — only the lanes you priced.
Five bullets summarize the whole RFP packet before anyone opens a PDF.
Replacescarrier conversations, 2026
  • “Two people run every bid for the whole sales team.”
  • “We touch three systems to build one set of rates.”
  • “Save it, copy it, upload it. Fifty times a week.”

The FreightMath Dashboard

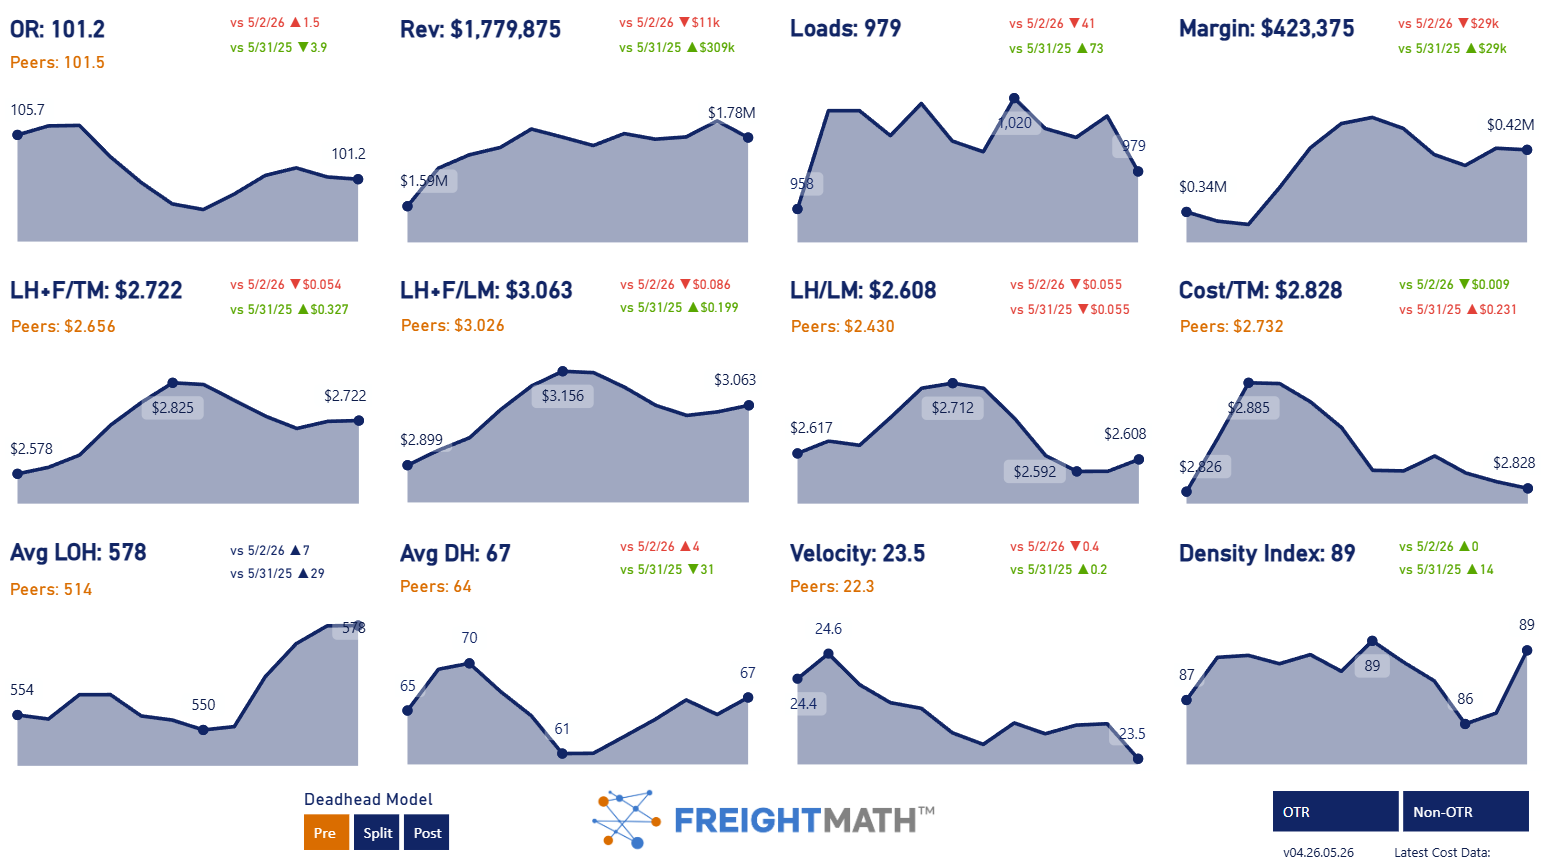
FreightMath dashboard home page - network OR, revenue, and volume KPIs Open the Sample Dashboard

A live, interactive Power BI report on synthetic carrier data — load-level OR, lane and customer profitability. No sign-in required.

Carrier Tested — Carrier Approved