The 5 Strategic Mistakes That Sink Change in Trucking
Jim Stockeland, with Abby Ryan & Max Herbst
Guest
1:45 PM
Beyond AI Fatigue: Why Trusted Data Comes First
Eric Jacobson (Tivitri), Adam Blanchard, David Knight
Guest
3:00 PM
How Carriers & FreightMath Are Using AI · Part 1
Facilitated by Chris Henry
This deck
4:00 PM
BidRight
Austin Knobloch, Nussbaum Technology
Guest
5:00 PM
Closing & adjourn · Networking at Culinary Dropout 6–8 PM
Chris Henry · Sponsored by Tivitri
This deck
Agenda · Day Two
Wednesday, October 7
Day Two: pricing, AI, and what comes next.
7:00 AM
Breakfast & networking · 3rd floor
8:00 AM
Securing Profitable Dedicated Freight
Brad Heisterkamp
This deck
8:45 AM
How Carriers & FreightMath Are Using AI · Part 2
Facilitated by Chris Henry
This deck
10:15 AM
Break
10:45 AM
Future of FreightMath · Roundtable
The FreightMath Team
This deck
12:00 PM
Lunch
1:00 PM
MileMaker: The Latest in Mileage & Routing
Peter Espinosa, MileMaker
Guest
1:30 PM
How Carriers & FreightMath Are Using AI · Part 3
Facilitated by Chris Henry
This deck
2:30 PM
Closing Remarks, Key Takeaways & Save the Date
Chris Henry
This deck
3:00 PM
Adjourn · Safe travels home
Press M at any time to jump to a session.
01 · Welcome
01
Tuesday · 8:00 AM · 30 minutes
Welcome: For Carriers, By Carriers
Chris Henry · FreightMath
Who we are: the FreightMath team, and why FreightMath and BidRight are your platforms.
What we shipped: the BidRight launch, and why we build in public.
Where the market is, and where it's going: today's truckload market and the FreightMath Autonomy Index.
What's next: benchmarking and the roadmap, led by API access and new markets.
01 · Welcome · The theme
Fall 2026 · The theme for these two days
For Carriers, By Carriers.
Not software built for carriers by people who've never run a truck. Tools built with carriers, by a team that has, and pointed wherever this room tells us to point them.
01 · Welcome · The Alliance
The FreightMath Alliance
A peer group, not a user group.
Your feedback will actively change the direction and prioritization of our near and long-term product roadmap.
You set the agenda
AI is the thread of these two days
Because you asked for it. Three working sessions, built around what you've built.
You set the backlog
New measures, features and apps that members have asked for
The Spot Check and Trip Check apps
API access
Dedicated Pricing
A full BidRight review
Net fuel cost per mile, peer per-power benchmarks, three-way velocity, revenue per power mile
Adam shows them at 10:45.
You set the standard
Every member sharpens the benchmark
Each member that joins FreightMath (and the Alliance), the goal is to outpace ‘quantity’ with ‘quality’ in order to ensure you have confidence in the benchmark data.
01 · Welcome · The FreightMath team
The FreightMath team
The people behind the math, and what they've built.
100+ years of combined trucking experience · $5B+ of freight under analysis
The Sage · Senior Advisor
David Roush
The Pacesetter · President
Chris Henry
The Architect · Carrier Intelligence
Dave Dunst
The Professor · Director of FreightMath
Jordan Nelson
The Visualizer · Engineering
Adam Smith
The Builder · Platform Developer
Pete Richards
The Data Craftsman · Senior Developer
Jim Clarke
The Operator · Vice President
Brad Heisterkamp
01 · Welcome · Your platform
FreightMath is YOUR platform · and so is BidRight
You ask. We build. You see it ship.
FreightMath · what members asked for
"Our network is mixed." Division slicers on the pricing pages, and multi-operation dashboards, our most-requested architectural change.
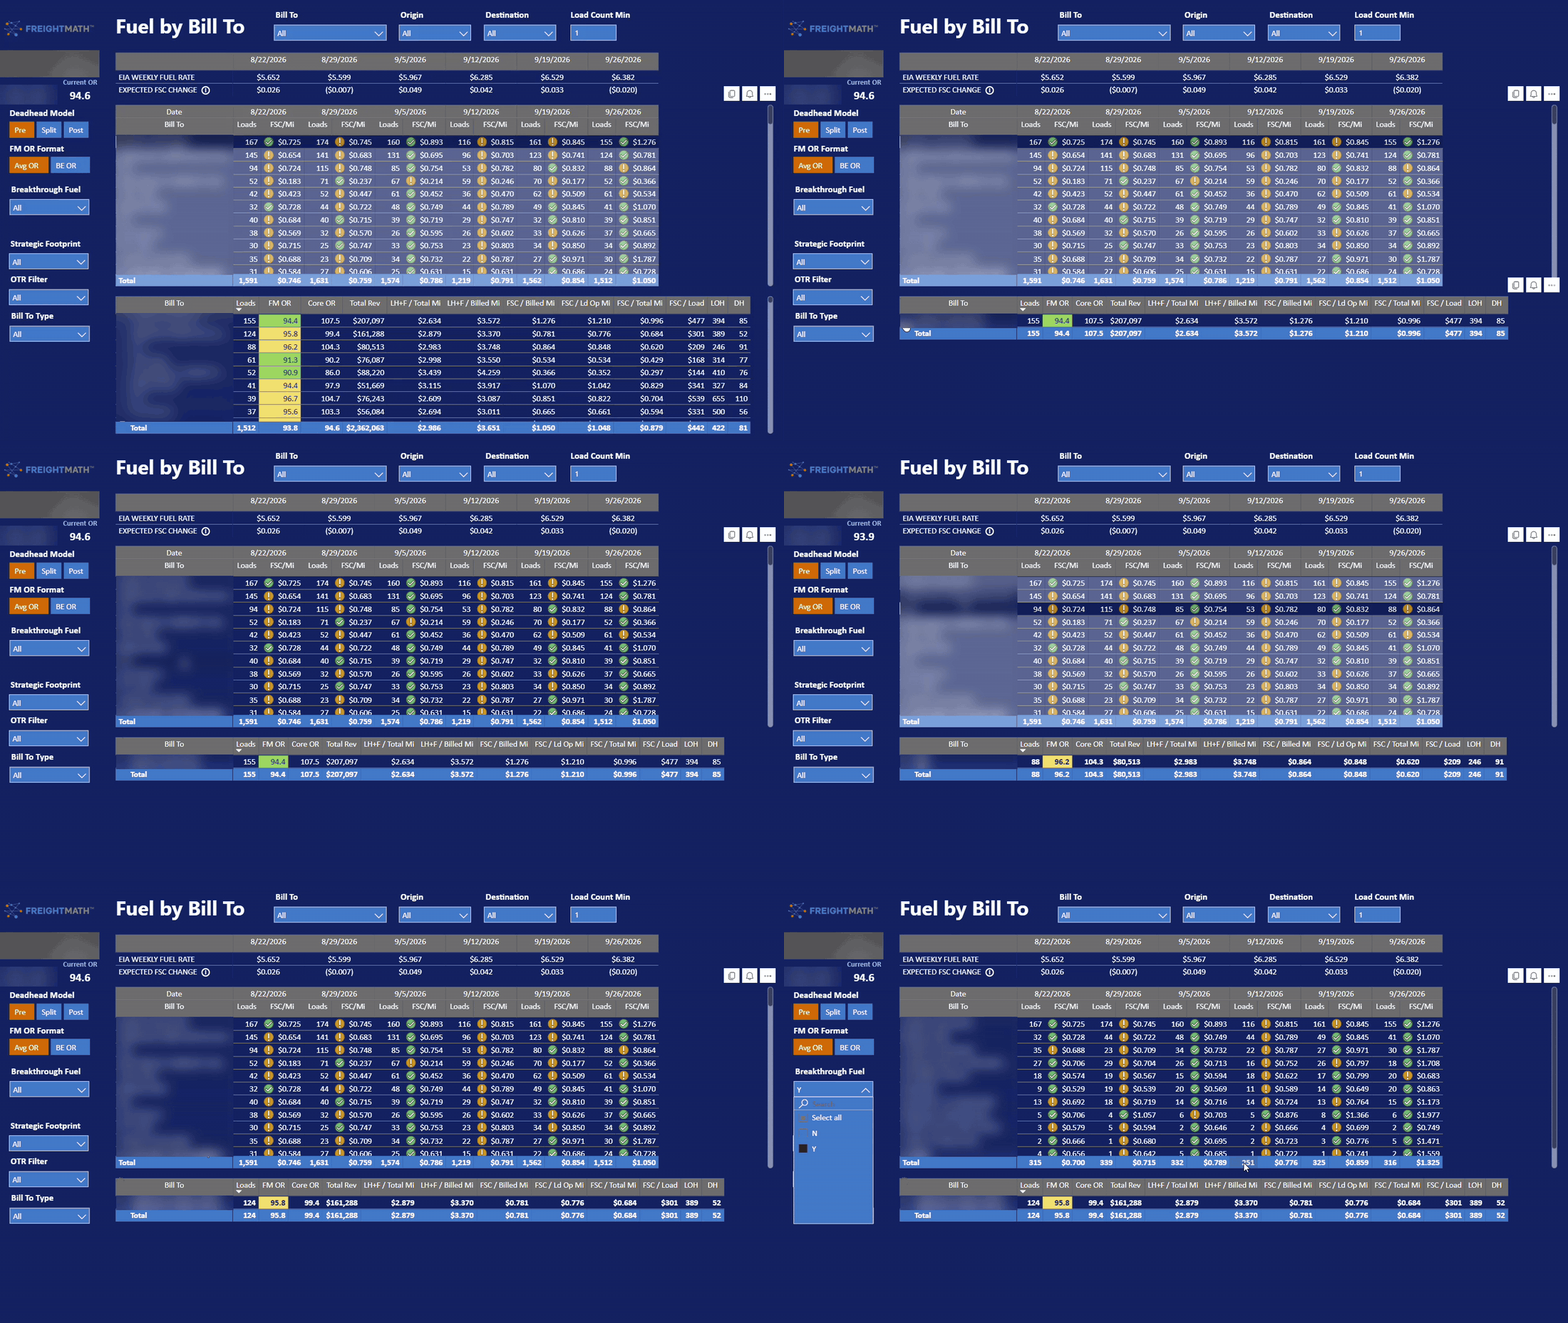
"Is fuel being recovered?" Net Fuel Cost / CO Mile, then Fuel by Bill To tracked against the EIA rate.
"Price to our target, not an average." Price Opportunity: your OR target, Lane Best and a confidence score.
"Was it us, or everyone?" Peer per-power benchmarks and Benchmark Breakdown.
BidRight · what carriers asked for
"Show me my real cost in the bid." FreightMath historical OR and Modeled OR on every lane.
"Give me a rate, but show the work." Auto Rate with reasoning on every lane. It proposes; you decide.
"Did we actually get the freight we won?" Commitments matched to actual hauled loads.
"What did we quote them last time?" Prior Bid Rates, Customer Files and the AI contract reader.
The proof is in this room: every agenda item today traces back to something a member asked for.
01 · Welcome · The BidRight launch
A Nussbaum Technology product · FreightMath built in
BidRight: from paid alpha to Early Access in 20 weeks.
FEB 10, 2026
Paid Alpha announced
Carriers commit, and pay, before the product is finished.
APR 10, 2026
Paid Alpha opens
Bids imported with 12,000+ lanes in the first week.
MAY 5, 2026
Alpha live
The first FreightMath-connected clients price real bids.
AUG 28, 2026
Early Access
Graduates from alpha, with commitments, AI insight and contract reading on board.
21
Weekly releases · Apr–Sep
20×
Faster bid generation*
+5%
Above market · 10 quarters*
22
Carriers in Early Access
*Nussbaum Technology results, as published on freightmath.com/solutions/bidright.
01 · Welcome · The BidRight launch
What shipped · April to September 2026
Twenty-one weeks. Twenty-one releases.
FreightMath inside the bid
Your cost on every lane
FreightMath historical OR + Modeled OR
Suggested RPM from your target OR
Carrier First, with regional fallback
DAT mapping alongside
AI, with the reasoning shown
It proposes. You decide.
Auto Rate with reasoning and market temperature
AI Bid Insight (Jul 31)
AI contract reader (Sep 4)
Target OR / Min Rate in Auto Rate
Bid to commitment
Closing the loop
Commitment tracking (Sep 4)
Commitments vs. actual loads (Sep 18)
Bid warehouse, Prior Bid Rates, Customer Files
10,000 lanes in about a minute
4:00 PMAustin Knobloch of Nussbaum Technology takes you through where BidRight is today, its use of AI, and where it's going.
01 · Welcome · Building in public
How we work
Building in public.
You see what we shipped, what's in progress and what broke, every week. Showing the unfinished work is deliberate.
Weekly · FreightMath
Release notes, every week
Four releases in four weeks (v4.3–v4.6), each leading with what you can do now, and each with an "In development" section.
Weekly · BidRight
"Here's what we shipped"
Nussbaum's weekly emails, plus a live milestone tracker showing what's ready, what's in review and what's in design.
Honest by default
Including the misses
v4.5 documented a benchmarks bug and the fix in public. "In development" means no confirmed ship date yet, and we say so.
WhyYou see things early enough to change them. Feedback in week two beats feedback at launch.
The ruleNo black boxes, in the methodology or in the roadmap.
01 · Welcome · The current marketplace
The truckload market · as of early October 2026
Tight because trucks left, not because freight came back.
DAT van spot · all-in
$3.01
Reefer $3.63 · Flatbed $3.60. Up 28–36% YoY. Week of Sep 20–26.
DAT truck posts vs. 2025
−20 to −26%
Van load-to-truck ratio 11.4 · flatbed 41.4.
EIA diesel · Sep 28
$6.38
Up $2.63/gal YoY. "Fuel drove the entire all-in increase." (DAT)
SONAR tender rejections
13.8%
Oct 1, down from 14.6% on Sep 19.
Supply
Capacity keeps leaving
Insurance, stricter driver requirements and federal enforcement keep removing trucks (C.H. Robinson). Spot equipment postings are the lowest in a decade (Arrive).
Demand
Cooling, not collapsing
August van spot linehaul fell 20¢, the steepest August drop on record; DAT calls demand "cooling." Accepted volumes are slightly below 2025.
Bottom?
The first shipment gain since 2023
Cass shipments rose 2.1% YoY in August, ending a record 42-month decline. Cass "hesitate[s] to describe this as a major improvement."
Sources: DAT (Sep 21–29), EIA (Sep 29), FreightWaves SONAR (Oct 1), Cass (Sep 14), C.H. Robinson & Arrive (Sep 2026). EIA updates Oct 6, so check the morning of.
01 · Welcome · The current marketplace
The sober read
Higher rates. Not necessarily higher margins.
Fuel is eating the gain
Much of the recent all-in increase is diesel passing through. DAT van linehaul sits at $2.17, and spot is still below contract (van by 22¢ in August). Is your surcharge actually keeping pace? That's Fuel by Bill To.
The demand side is mixed
ISM manufacturing at 54.5 (9th month of expansion), and September imports were the busiest month of 2026 (NRF). But consumer sentiment is weak (47.8), and the tariff truce runs only to early January.
The outlook
Expect Q4 volatility and possible spikes, with minimal spare capacity heading into peak season and winter. C.H. Robinson sees 2027 rates up about 10%, driven by supply rather than demand.
Discuss
Are your contract rates moving, or only your spot loads?
Discuss
How much of your rate gain survives after fuel?
Discuss
Are you adding trucks into this market, or holding?
Sources: DAT (Sep 15 & 28), ISM (Oct 1), NRF Global Port Tracker (Sep 22), C.H. Robinson (Sep 2026), NTG (Sep 30).
01 · Welcome · The current marketplace
The DAT Rate Index and alternatives
What the market pays isn't what you need.
Rate indexes tell you where the market is. FreightMath tells you the rate your network needs to hit your OR. Price Opportunity now scores every move against three independent references.
Market reference
DAT
The industry's most-quoted rate benchmark, built from contributed transaction data. Useful as a market pulse, but it has no view of your network, your costs or your density.
Answers: "What is the market paying on this lane?"
Peer reference · FreightMath
Carrier First
The rate index across all current FreightMath clients: actual carrier-hauled freight from asset carriers like you, normalized by the same costing methodology.
Answers: "What are carriers like me actually getting?"
Your own reference
Lane Best
Not the lane average but the best LH+F the lane has already proven it will pay you. It's your own ceiling, from your own history.
Answers: "What has this customer already paid me?"
ConfidenceHigh: two or more references above your move rate. Medium: one above, none below. Low: one above, one or more below. Push the High rows first.
DiscussWhich index do you price from today (DAT, Truckstop, SONAR, Greenscreens, a broker feed)? Should Carrier First become a published Alliance rate index?
01 · Welcome · What's on the Horizon that Carriers Need to be Paying Attention to
Introducing · new for this meeting
The FreightMath Autonomy Index.
01 · Welcome · Benchmarking
FreightMarks · Benchmarking
See where you stand. Never who's who.
Live
Per Mile view
Every cost line on the standard chart of accounts, per mile, against the peer pool's average and range.
Live
Mileage Group view
Peers grouped by length of haul, so a 400-mile network isn't compared with a 1,200-mile one.
Coming next
% of Revenue view
The same benchmarks as a share of revenue. That's how your CFO and your lender already read a P&L.
Our rules · always
Anonymized and aggregated. No individual carrier names, ever.
Pools, not peers. You see the peer count, average and range, and where you sit.
One standard. MapLedger maps every GL to the same chart of accounts.
Closed months only. No half-finished months in anyone's numbers.
8:30 AMPete and Chris go deep on MapLedger and benchmarking next.
01 · Welcome · Roadmap
Roadmap · leading with two
What's next: open the platform, open new markets.
01 · Open the platform
Beta · available now
API access
Programmatic access to your FreightMath data: feed your BI, your warehouse and your own AI agents, with no exports in between.
Jordan covers it at 10:45 today
Connecting LLMs to your data: Wednesday, 10:45
02 · New markets
In progress
Beyond one-way truckload
Logistics & brokerage: the Logistics Dashboard, and BidRight preparing for logistics pricing ("Asset Rates")
Dedicated: the pricing suite and Brad's advanced model
Canada & cross-border: KSMTA Canada, LCV costing and cross-border bids
01 · Welcome · Roadmap
Roadmap · and also coming
The rest of the roadmap, at a glance.
Live today
SpotCheck & TripCheck
The rebuilt pricing suite. Hands-on at 10:45.
Q1 2027
The FreightMath web app
Goodbye to SharePoint and Power BI. Native, mobile, AI-ready.
Underway
Benchmarking, rebuilt
A redesigned MapLedger benchmarking dashboard, plus Cohorts for narrower peer groups.
Next year
Telematics
Actual miles and hours replace inferred ones.
In development
FreightMath Actions
The key levers moving performance, and the items you agreed to track.
In development
Lane & segment fuel
A per-segment fuel index for geographically accurate cost.
In development
Control Room App
Area control, trailer pools and custom network logic, self-service.
Wednesday 10:45
You set the order
Future of FreightMath: we vote on what ships first.
01 · Welcome · The two days ahead
What to expect
Two days. Three threads.
Thread 1 · Precision
How the numbers are made
MapLedger: adjusted revenue and apples-to-apples benchmarking
Segment-Level Costing: from the GL down to every segment
MileMaker: the miles and time underneath every metric
Thread 2 · Decisions
Putting OR in front of the decision
Dashboard: what's new since Spring
SpotCheck & TripCheck: hands-on, so bring your login
Dedicated: pricing the fleet, the driver and the schedule
BidRight: bid import to commitments
Thread 3 · AI
A three-part working session
Part 1: where AI is already working for you, the wins and the concerns
Part 2: where AI moves OR, governance and your next step
Future of FreightMath: connecting LLMs to your data
Part 3: open floor
For carriers, by carriers: bring what worked and what didn't.
02 · MapLedger
02
Tuesday · 8:30 AM · 60 minutes
MapLedger: Current State & Benchmarking
Pete Richards, with Chris Henry · FreightMath
FreightMath Adjusted Revenue: how we scale costs so the FreightMath OR aligns with the OR from your GL.
Benchmarking: the standardized chart of accounts is what makes apples-to-apples benchmarking possible across the Alliance.
Best practices & use cases: how members are using MapLedger today and tackling common problems.
02 · MapLedger · Vision
MapLedger · Where this goes
Vision: what MapLedger becomes.
Transparency
Open the cost side of the house to more people in the organization
Benchmarking
Benchmark against peers
Credibility
Increase the credibility of the results
What If
Visualize your potential
Forecasting
Forecast into the future
Literacy
Improve the financial literacy of clients and their people
02 · MapLedger · Key Enhancements
MapLedger · Mapping & Distribution
Key Enhancements
What's new
Dynamic function: allocate and distribute using any FreightMath operational statistic
Adjustments: smooth large variances. Override individual accounts and values, or auto-variance activity by account across up to 12 months
Enterprise view: consolidate operations inside the Review (P&L View)
New peer benchmarking modals, with more to come
What If Scenario Builder
02 · MapLedger · Benchmarking
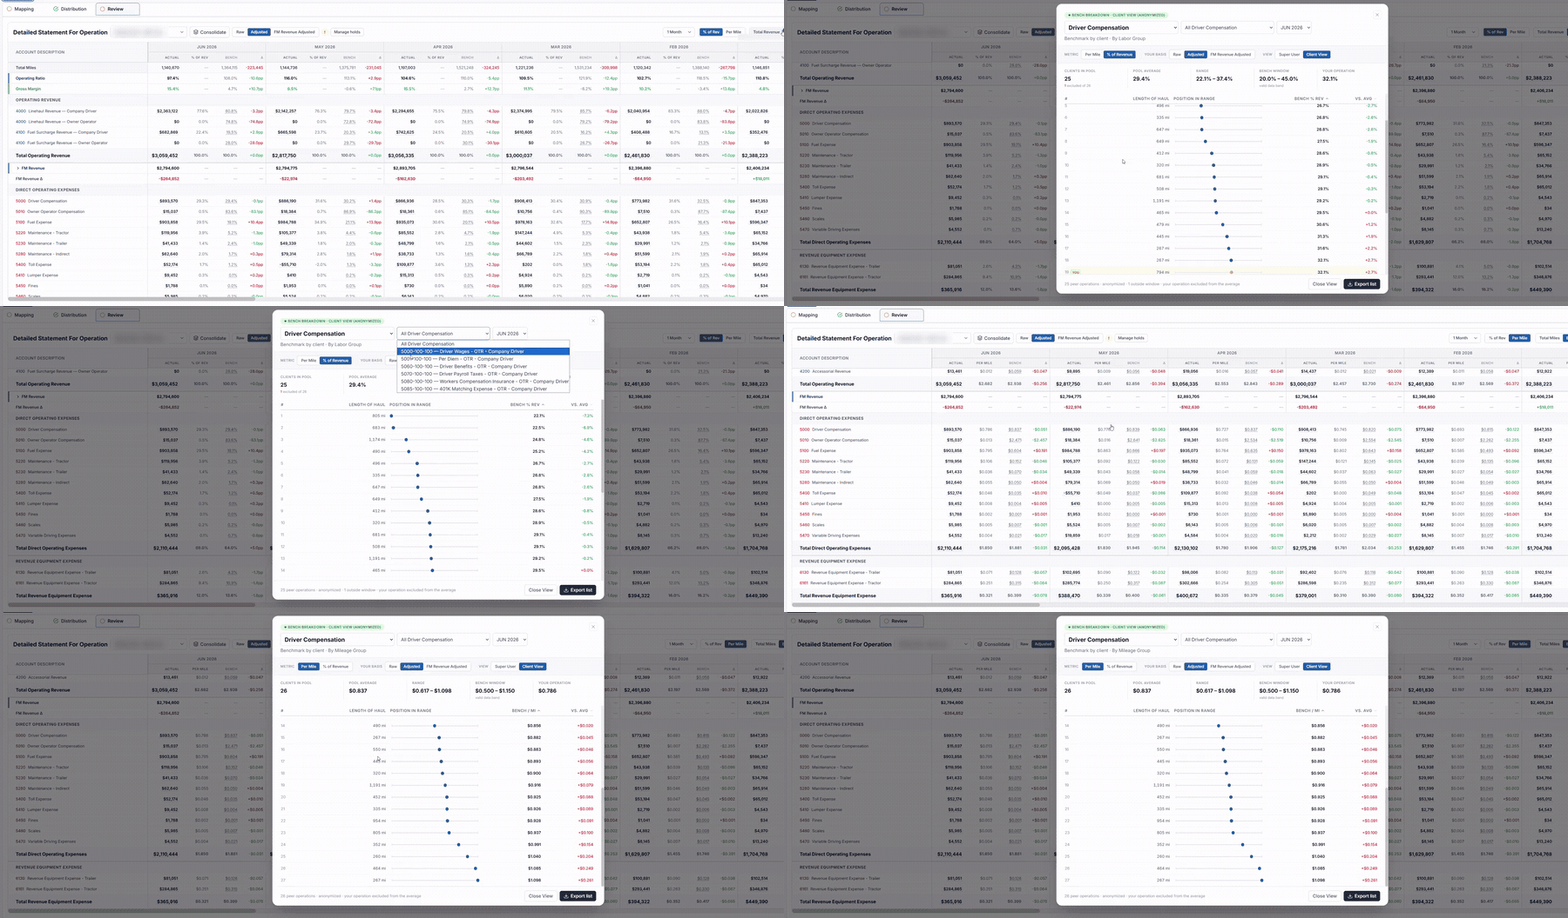
MapLedger · The Detailed Statement, benchmarked
Every line, against the pool.
Toggle the lens
% of Revenue or Per Mile, by Labor Group or Mileage Group.
Choose the basis
Raw, Adjusted or FM Revenue Adjusted.
Open any bench
See the anonymized pool: peer count, average, range and where you sit.
Client and carrier names blurred.
02 · MapLedger · Peer Benchmarking
MapLedger · Peer Benchmarking
Where you stand on every metric.
Rank every metric
Pick a metric and the cohort re-ranks around it, with You in the middle of it.
Your cohort's P&L
The same Detailed Statement, benchmarked against your cohort (e.g. TC06 · Dry Van).
Pool, by mileage group
Peers ordered by bench value, with length of haul alongside.
Peer and client names blurred.
02 · MapLedger · Your potential
MapLedger · Your potential
What if you matched the best in class?
Set the target
Match the average or best in class of every FreightMath client, or just your cohort, by % of revenue or per mile.
See the gap
Operating ratio, operating income and cost per mile, today vs. at target.
Line by line
Keep your own number where it's right, and see the statement at target.
Client name blurred.
02 · MapLedger · Best practices
Discussion · Best practices & use cases
How are you using MapLedger?
Starter 01
Who in your company opens MapLedger, and for what decision?
Finance close, ops reviews, the board, lenders? Where has it changed a conversation?
Starter 02
Which benchmark surprised you the most?
Was it a real operating gap, or a mapping difference? How did you tell?
Starter 03
What's the hardest part of your GL to map?
Shared services, intercompany, owner-operator settlements, multiple divisions. What should the standard handle better?
03 · Segment-Level Costing
03
Tuesday · 9:30 AM · 60 minutes
Segment-Level Costing
Dave Dunst · FreightMath
How FreightMath moves cost from the GL down to the individual segment, end to end and bucket by bucket.
How it works: four components, one cost model.
Driver pay: how compensation reaches the individual segment.
Allocation of cost buckets: a waterfall within every bucket.
Deadhead models: PRE, SPLIT and POST.
Forecasting: costing segments before the GL month closes.
03 · Segment-Level Costing · How it works
How it works
Four components. One cost model.
It isn't a sequential pipeline. These are four core components that together make up the full cost picture, from what the customer paid you to what your books actually say.
"What the customer paid you to do"
Orders
Revenue
+
"What you did"
Segments
Assets · Miles · Hours
+
"What you paid your drivers"
Driver Pay
Direct cost
+
"What your books say"
GL Extract
Operating Ratio
03 · Segment-Level Costing · Segments
Deep dive · Segments
Segments: the activity layer.
Every point-to-point movement of an asset. This is where cost actually gets incurred.
Every point-to-point movement of your assets counts, loaded or empty.
Every mile run and every minute spent incurs cost.
A segment isn't locked to a single order:
A loaded segment can be pulling multiple trailers at once.
An empty segment can fall between two orders. Under the Split model, its miles and hours are divided half to each.
Miles and hours are standardized zip-to-zip using MileMaker, not raw TMS numbers.
Guardrail calculations catch and correct incorrect TMS miles and hours.
03 · Segment-Level Costing · Deadhead
Deep dive · Segments, continued
Deadhead models.
Three ways to assign empty miles to an order, including the Split model above.
PRE
Assigned forward
To the order that follows the empty run. All empty miles run before the order are assigned to it.
SPLIT
Shared
Divided between the two orders the empty miles connect.
POST
Assigned back
To the order that precedes the empty run. All empty miles run after the order are assigned to it.
End of datasetThis applies to POST and SPLIT only. For orders at the end of the dataset the next order isn't known yet, so empty miles are forecast from the average post-deadhead miles for orders moving into that destination area.
03 · Segment-Level Costing · Driver pay
Deep dive · Driver pay
Driver pay: the allocation waterfall.
Pay is ingested at the Pay Type + Dispatch level where possible, then run through a four-step waterfall.
1
Filter by Pay Type
Decide whether a Pay Type should flow to segments at all. Types like Bonus and Vacation are excluded.
2
Direct dispatch match
Pay tied to a specific dispatch goes directly to the segments within that dispatch.
3
Spread non-dispatch-specific pay
Pay not tied to one dispatch is spread across all dispatches active that pay week.
4
Estimate the gaps
Dispatches with no recorded pay get an estimate from average pay by Driver Type.
Custom logicEvery client can layer their own rules on top of the standard waterfall.
03 · Segment-Level Costing · Cost buckets
Allocation of cost buckets · Hourly-distributed
A waterfall within every bucket.
Each GL bucket is a pool of dollars. Where a Prestandard carve-out applies, it's pulled first and distributed a specific way. The remainder then flows through the standard Calc Basis.
GL Bucket
Labor group
Prestandard carve-out
Remainder → Calc Basis
Driver Recruit
ALL
none
% of Hours
Fixed OH
ALL
50% split equally across all Orders
remaining 50% → % of Hours
Non-Driver Comp
ALL
50% split equally across all Orders
remaining 50% → % of Hours
Permit / License / Tax
ALL
none
% of Hours
Technology
ALL
50% split equally across all Orders
remaining 50% → % of Hours
Tractor
CO
none
% of Hours
Reefer
ALL
none
Weighted % of Reefer Hours
Trailer
ALL
none
Trailer Pools and Gen Pop → see Trailer Cost
ReeferWeighted % of Reefer Hours is weighted by Order Temperature Category. A deep-frozen load accumulates cost at a higher rate than a chilled load.
03 · Segment-Level Costing · Cost buckets
Allocation of cost buckets · Mileage-distributed
Mileage-distributed buckets.
Same logic, driven by miles instead of hours: the carve-out first, then the remainder by Calc Basis.
GL Bucket
Labor
Prestandard
Calc Basis
Commissions
ALL
Order-specific commissions
% Billable Miles
Purchased Trans
ALL
Carrier Pay
% Carrier Pay
Driver Comp
CO
Driver Segment Pay
% CO Miles
Driver Comp
LP
Driver Segment Pay
% LP Miles
Driver Comp
OO
Driver Segment Pay
% OO Miles
Escort
ALL
none
% Miles
Fines
ALL
none
% Miles
Fuel
ALL
none
% Miles
Fuel
CO
none
% CO Miles
Fuel
LP
none
% LP Miles
Insurance
ALL
none
% Miles
GL Bucket
Labor
Prestandard
Calc Basis
Insurance
CO
none
% CO Miles
Lumper
ALL
none
% Miles
Maint. – Indirect
ALL
none
% Miles
Maint. – Tractor
CO
none
% CO Miles
Maint. – Tractor
LP
none
% LP Miles
Maint. – Trailer
ALL
none
% Miles
Permit General
ALL
none
% Miles
Permit Over
ALL
none
% Miles
Scales
ALL
none
% Miles
Tolls
ALL
none
% Tolls
Variable Driving
ALL
none
% Miles
Trailer Pools don't affect Maintenance – Trailer.
03 · Segment-Level Costing · Trailer cost
Deep dive · Trailer cost
Hourly trailer cost: the pool waterfall.
How the Trailer bucket splits between named Trailer Pools and everything else, which we call Gen Pop.
1
Cost per Trailer Day
Total Hourly Cost ÷ (Trailer Count × Days)
2
Cost per Trailer Pool
The per-day rate × each pool's Trailer Pool Day count.
3
Distribute to segments as % of Hours
If an order touches an Origin pool and a Destination pool, the affected segments get half their trailer cost from each.
4
Isolate Gen Pop cost
Total Hourly Cost − Distributed Trailer Pool Cost
5
Distribute Gen Pop cost
Spread as % of Gen Pop Hours.
No trailer costA segment can be set to receive no trailer cost. It's excluded from trailer cost distribution entirely, whether it's in a pool or Gen Pop.
LCVs / DoublesA segment pulling two trailers receives full trailer cost for both, not split and not averaged.
03 · Segment-Level Costing · Forecasting
Forecasting · 1 of 3
Hourly / Overhead buckets.
Every Hourly bucket forecasts off the percentage of workdays completed, not a straight run-rate.
1
Average GL Cost
The average actual GL cost for that bucket over the most recent 1 or 3 months. The client chooses 1 or 3.
2
% of Workdays Completed
Measured against a customizable workday calendar: each carrier's actual operating calendar, not a generic calendar-day count.
3
Forecasted Cost
Average GL Cost × % Workdays Completed
03 · Segment-Level Costing · Forecasting
Forecasting · 2 of 3
Mileage / Variable buckets.
Every Mileage bucket follows a trailing cost per mile.
1
GL Miles anchor
GL Miles from the most recent actual GL month: the known starting point.
2
Cost per Mile
GL Cost ÷ GL Miles
3
Forecasted Cost
Cost per Mile × Miles run this month
Excludes fuelFuel gets its own breakdown next.
03 · Segment-Level Costing · Forecasting
Forecasting · 3 of 3
Fuel cost: its own breakdown.
The Mileage/Variable formula plus one extra multiplier: the weekly change in the DOE fuel price.
1
GL Miles anchor
GL Miles from the most recent actual GL month.
2
DOE $/gal: base week
The DOE weekly price at the GL anchor.
3
Cost per Mile
GL Cost ÷ GL Miles
4
DOE $/gal: current week
The latest published DOE weekly price.
5
DOE weekly % change
DOE current week ÷ DOE base week
e.g. $3.85 ÷ $3.50 = 1.10
6
Forecasted Cost
CPM × DOE % Change × Miles this month
03 · Segment-Level Costing · Forecasting
Forecasting · Recap
Three engines. One shape.
Fuel is the Mileage/Variable formula with one extra adjustment layered in.
Bucket type
Anchor
Adjustment
Scales by
Hourly / Overhead
Average GL Cost
—
% Workdays Completed
Mileage / Variable
GL Cost ÷ GL Miles
—
Miles run this month
Fuel
GL Cost ÷ GL Miles
× DOE % Change
Miles run this month
03 · Segment-Level Costing · Closing
Segment-Level Costing
One model. Every dollar. Every load.
From the GL down to a single segment, through activity-based logic customized for you.
The components
Orders, Segments, Driver Pay and GL Extract: revenue, activity, direct cost and OR.
Every bucket, a waterfall
Prestandard carve-out first, then the remainder by Calc Basis. No exceptions, just sequence.
Deadhead & trailer pools
PRE / POST / SPLIT, and named pools vs. Gen Pop, for the miles and hours that don't map 1:1 to an order.
Forecasting
Time-based for overhead and activity-based for mileage, with the DOE adjustment layered on for fuel.
03 · Segment-Level Costing · Your feedback
Discussion · Where this model goes next
Does this match how you actually operate?
Driver pay
Does the pay waterfall match how you actually compensate drivers?
Pay types we exclude, per-diem, bonuses, guarantees, owner-operator settlements. Where does it miss?
Fuel
Does the weekly DOE change track what you really pay for fuel?
Bulk contracts, hedges, discounts off retail, surcharge recovery. What would make the fuel number yours?
Open floor
Which cost bucket do you trust least today?
Where would you not yet defend the number to a customer? That is what we fix next.
Dashboards (Adam): Pricing Opportunity, Load Detail, new measures, the Logistics Dashboard, summary and analysis pages, and release notes v4.3–v4.6.
The Pricing Suite (Jordan): SpotCheck revamped, TripCheck brand new and Dedicated Pricing expanded. Worked hands-on at app.freightmath.com, so bring your login.
04 · Platform · FreightMath Dashboard Updates
Part A · Adam Smith · FreightMath
FreightMath Dashboard Updates
What's new in the FreightMath and Logistics dashboards since Spring: pricing opportunity, load detail, and the summary and analysis pages members use every day.
Pricing Opportunity
Load Detail
New Measures
Logistics Dashboard
Release Notes v4.3–v4.6
04 · Dashboard · Pricing Opportunity
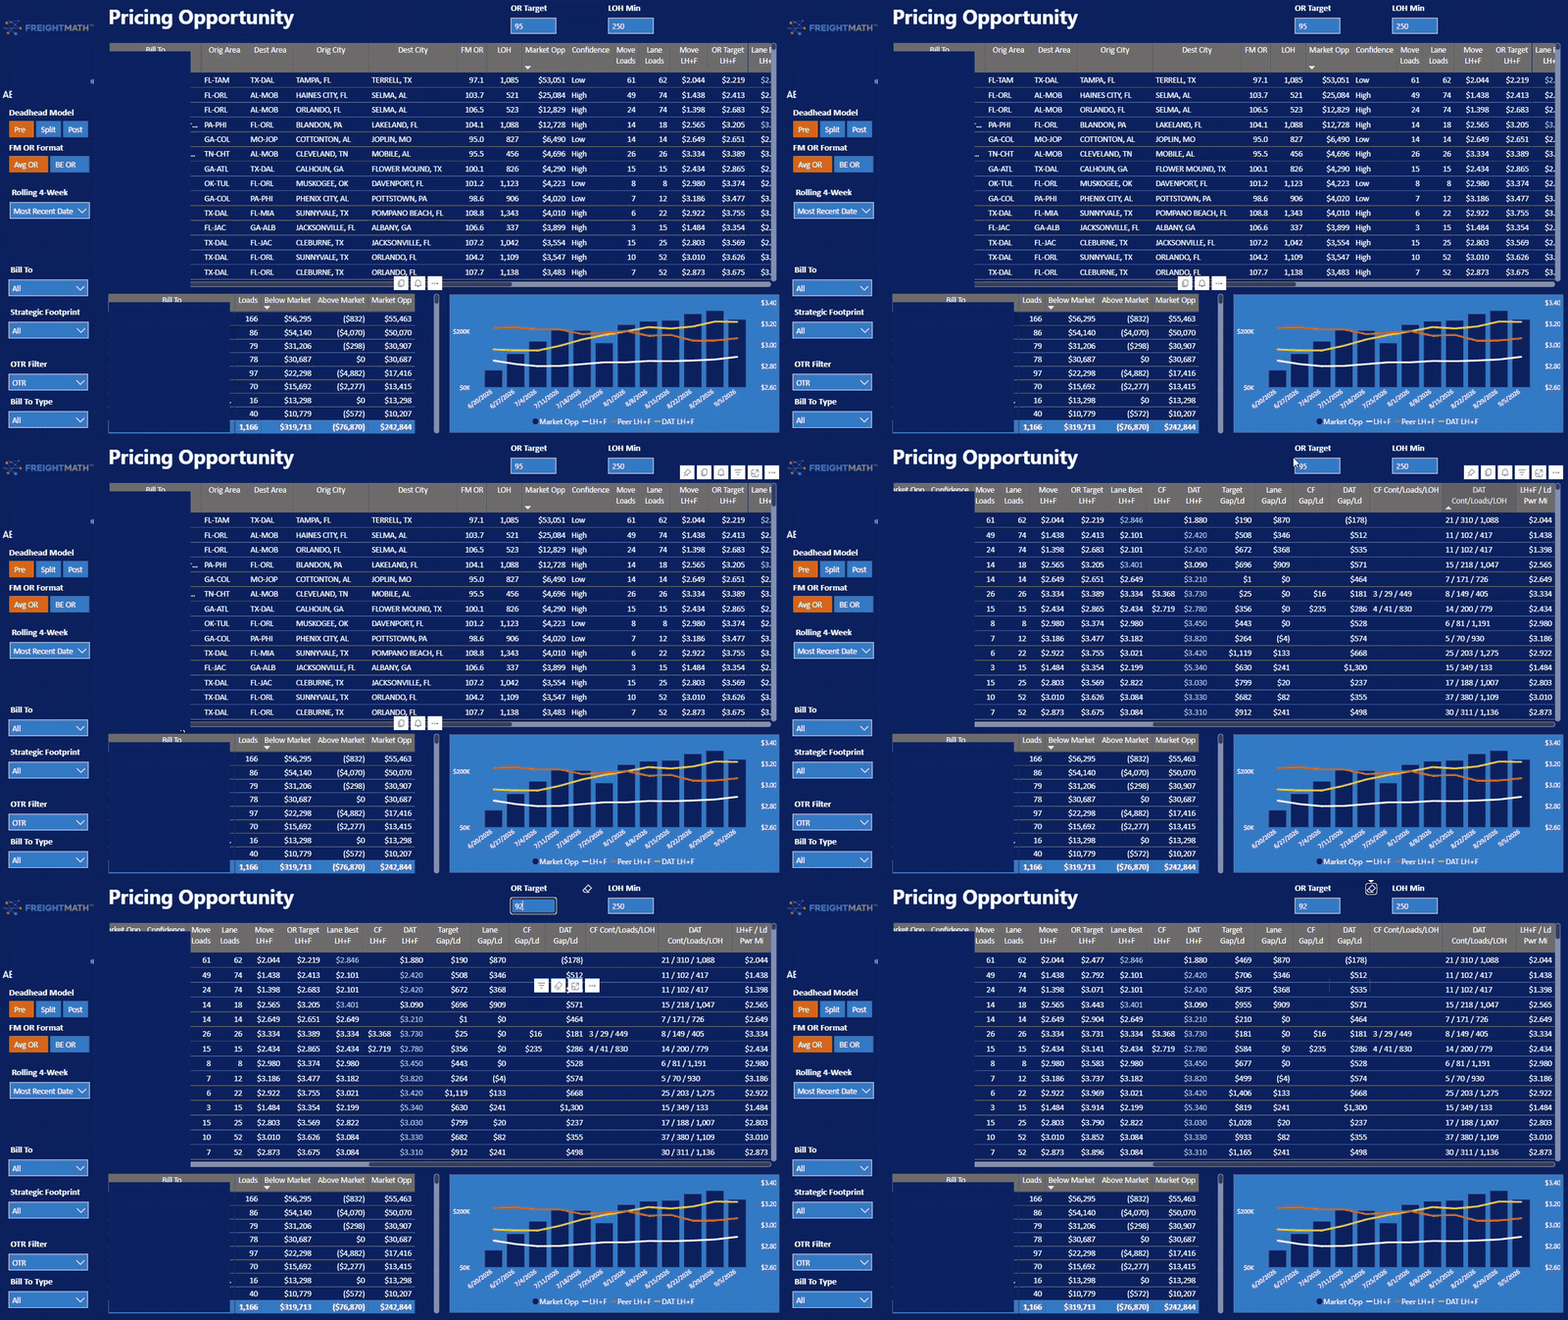
Pricing Opportunity
Pricing opportunity, lane by lane.
Every Bill To's lanes are ranked against three rate benchmarks, with a confidence tier and an adjustable OR target deciding what surfaces.
Lane Best, Carrier First, DAT: each lane's rate is checked against three benchmarks, not one.
Gap / Load: the dollar gap against Lane Best and Carrier First, sized per load, not just flagged as over or under.
Confidence: a High / Low tier, so reps know which gaps have enough volume behind them to act on.
OR Target: one adjustable input (95 here) recalculates which lanes clear the bar.
04 · Dashboard · Pricing Opportunity
Pricing Opportunity, continued
Below market. Above market. Net opportunity.
Every Bill To rolled up into three numbers: what's priced below market, what's priced above, and the net dollars still on the table.
Bill To rollup, sorted by opportunity size: Below Market, Above Market and net Market Opp.
Loads in this book
2,368
Below-market opportunity
$644,464
Already priced above market
($169,239)
Net Market Opp
$475,198
04 · Dashboard · Load Detail
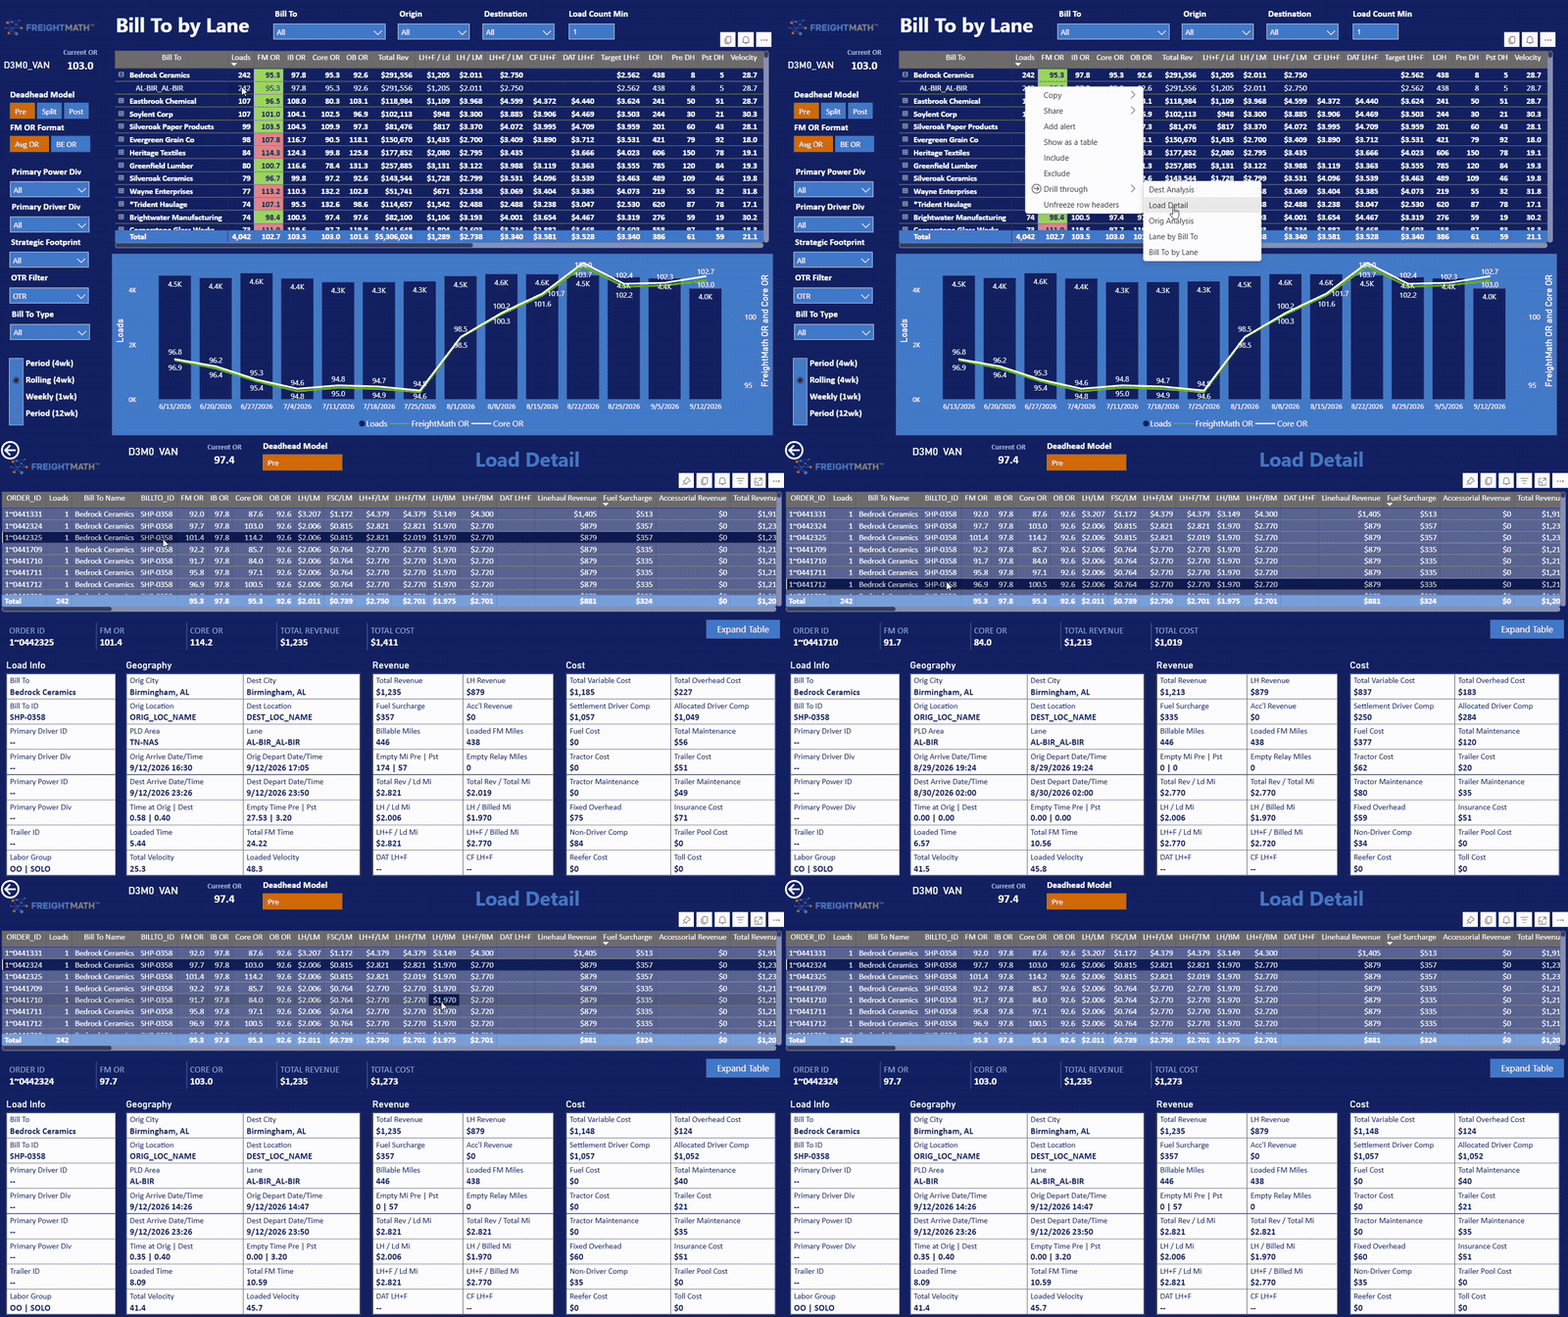
Load Detail
Load Detail, redesigned.
Order 2~0936619 · Clearwater Lumber, Chicago, IL → St. Louis, MO · FM OR 101.0 / Core OR 86.5
Deadhead Model is visible per order (Pre / Post / Split), not just set at the report level.
Core OR sits next to FM OR and IB / OB OR: the segment-level and order-level numbers on one screen.
Four card groups (Load Info, Geography, Revenue, Cost) replace scattered fields.
Expand Table opens the full order grid without leaving the page.
04 · Dashboard · New measures
New measures
New measures members asked for.
Added directly to the dashboard's measure library this cycle.
Net Fuel Cost / Total CO Mile
Fuel cost net of surcharge recovery, normalized to company-owned miles.
Peer per-power benchmarks
Peer Total Rev / Power, Total Miles / Power and Loaded Miles / Power: three peer cuts per power unit.
Velocity: Total, Transit, Loaded
Network miles per hour, cut three ways:
Total: total miles ÷ total time, excluding Detached Time
Transit: miles ÷ time moving, excluding origin and destination dwell
Loaded: loaded miles ÷ loaded time only
Revenue / Power Mile
Built for LCV and LTL use cases, where revenue per load understates what a power unit actually produces.
04 · Dashboard · Logistics Dashboard
New this cycle
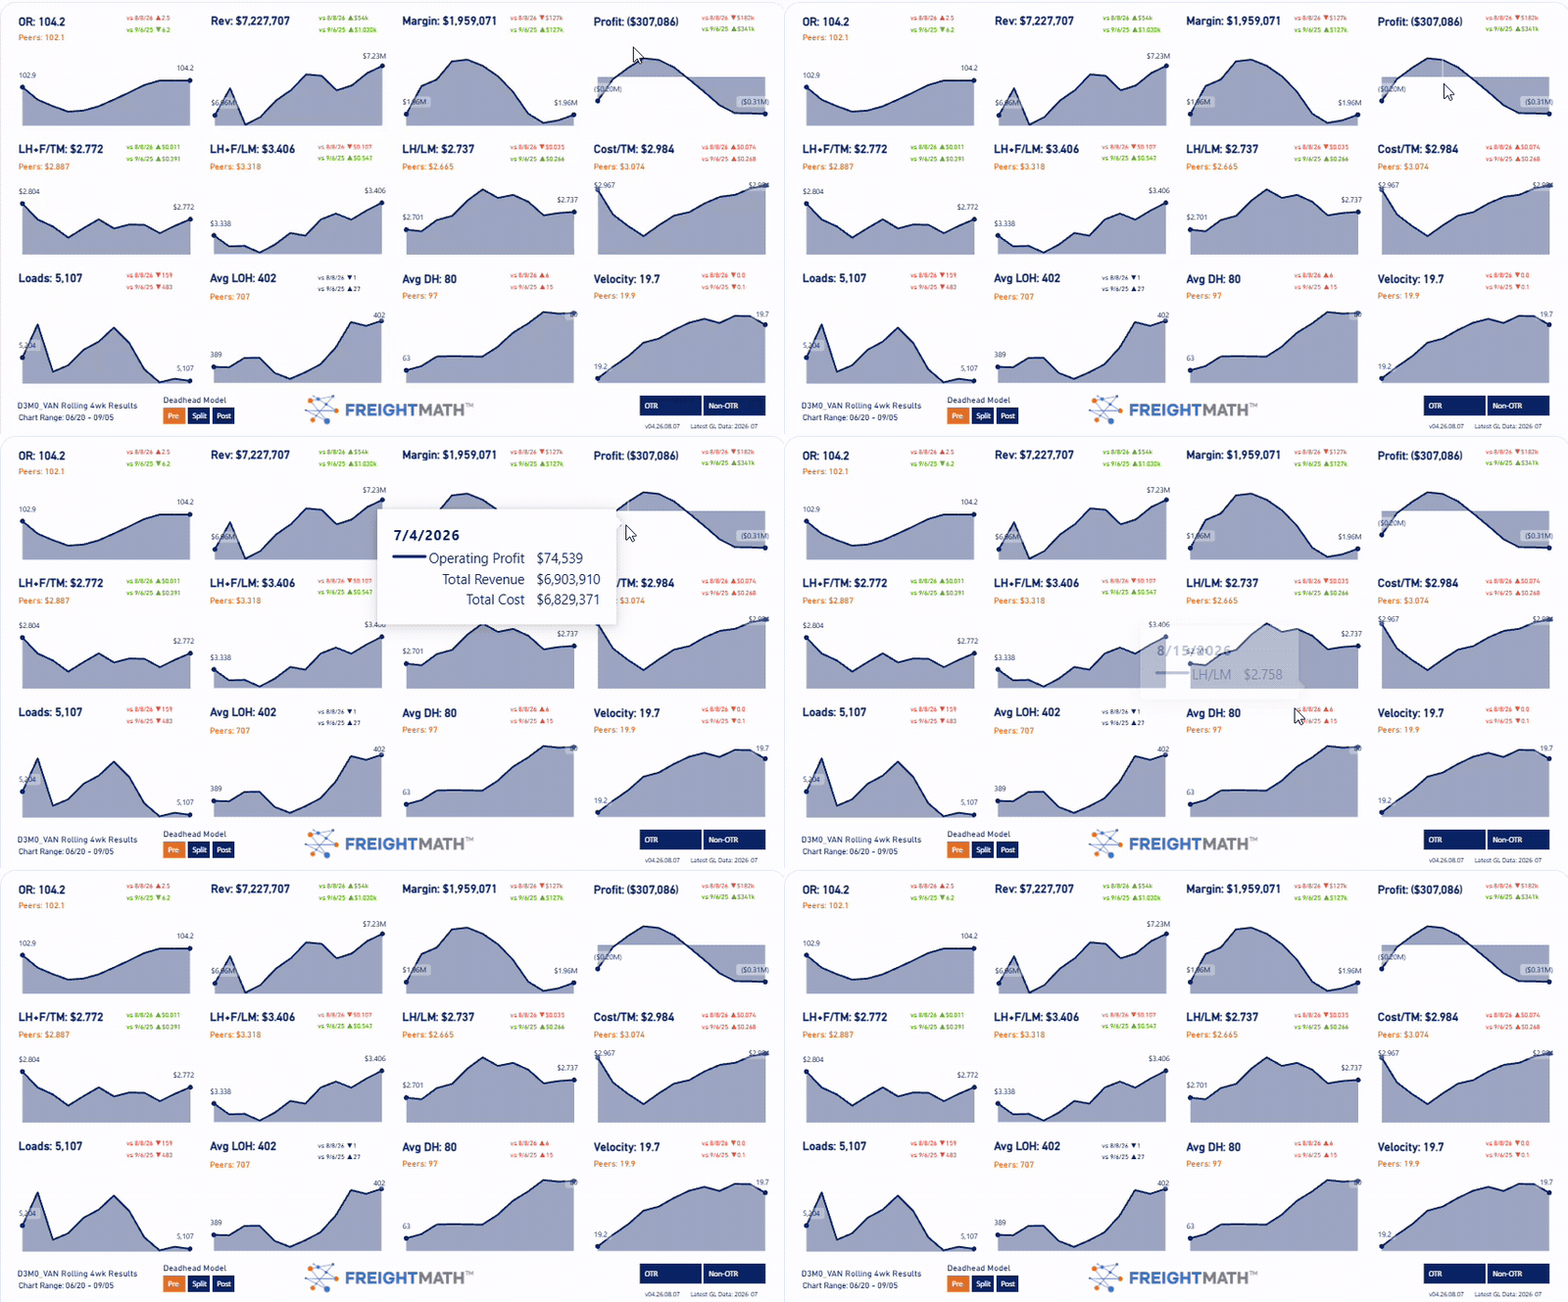
Introducing the Logistics Dashboard.
Rolling 4-week results, 07/04–09/19 · OR 97.5 · Revenue $17.2M · Margin $2.45M (14.2%)
New for most members this cycle: one page of rolling 4-week trend tiles.
Every tile compares against the prior period and the same period last year, so a move reads as trend, not noise.
OR, revenue, margin ($ and %), margin/load, loads, revenue/load, pay/load, revenue/mile, negative-margin share, overhead/load and loads/carrier.
04 · Dashboard · Summary pages
Summary pages
Three summary pages. One consistent layout.
Bill To Analysis · 7,142 loads, $17.2M revenue, $2.45M margin (14.2%), OR 97.5, with 16 weeks of loads vs. OR.
Bill To, Lane and Carrier each get a summary with the same columns and layout, sliceable by the other two.
Bill To
By Lane · By Carrier · By Orig Area
Lane
By Bill To · By Carrier
Carrier
By Lane · By Bill To · By Orig Area
04 · Dashboard · Analysis pages
Analysis pages
Dig deeper into any Bill To, Orig Area or Carrier.
Analysis for Bedrock Supply Co · OR 101.5 across $305,820 revenue and 170 loads.
Pick one value on any of the three axes and get the same drill-down: the other two axes, plus the trailing loads/OR trend underneath.
Same column set as the summary page, scoped to one value, so reps don't relearn a layout to go deeper.
The other two tables update together whenever the filter changes.
Scan or type it in. We'll work the same lane together.
04 · Pricing Suite · How it works
4,000–6,000
SpotChecks run by FreightMath clients every month since SpotCheck moved from Excel to a web app in 2024. The rebuild makes the tool members already rely on faster, deeper and far more flexible.
How FreightMath prices freight
Start with the margin. Back into the rate.
Step 1
Set the target
Choose the profitability the freight has to hit. Your OR, your call.
→
Step 2
Model the load precisely
Miles, hours and every cost, built from actual load data and your own cost profile.
→
Step 3
Back into the revenue
The rate required to hit your target. That's the number you quote from.
The mathRevenue needed = Modeled cost ÷ Target ORYour costs, not an industry average. Your target, not a market guess.
04 · Pricing Suite · 01 SpotCheck
01 · SpotCheck · Complete revamp
SpotCheck, rebuilt end to end.
What you've been using
What's live today
Interface
Limited, built in Microsoft Power Apps
A web application built from scratch, with a completely new UI
Speed
External connections ran one after another
Every connection runs at once, independently
Configuration
Limited control over the model
Miles, times, costs, stops and reefer fuel burn
Pricing target
FM OR2 only
Core OR, FM OR and FM OR2
Roundtrips
Workarounds
Native, one entry
04 · Pricing Suite · 01 SpotCheck
01 · SpotCheck · New interface
Same lane. A whole new SpotCheck.
Drag the slider to go from the SpotCheck you know to the one that's live today.
BeforeNow
04 · Pricing Suite · 01 SpotCheck
01 · SpotCheck · Rebuilt backend
So how long does a quote take now?
The backend was rebuilt from scratch. Every external connection now runs at the same time, independently, so one slow source no longer holds up the rest.
Before
Each connection waits on the one before it
Miles and routing
Tolls
Fuel
Market rates
FreightMath cost model
✓ Quote ready
Now
Every connection runs in parallel
Miles and routing
Tolls
Fuel
Market rates
FreightMath cost model
✓ Quote ready
Illustrative, not to scale
04 · Pricing Suite · Demo
Demo · Step 1 of 3 · Enter the lane
Two fields in. A fully modeled load out.
Minimum input: an origin and a destination. That's all SpotCheck needs to start.
Modeled for you: miles, hours and the full FreightMath cost build for the lane.
Then you steer: adjust the assumptions and see the rate needed to hit your target.
04 · Pricing Suite · Demo
Demo · Step 2 of 3 · Read the model
See every cost before you quote.
1
Lane and equipment
Origin, destination and equipment set up the model.
2
Modeled miles and hours
Loaded and empty miles plus hours under power, modeled for this lane.
3
The cost build
Mileage-based and time-based cost: the same FreightMath costing behind your dashboards.
4
Pricing targets
Select the OR, choose the profitability and set FSC. SpotCheck solves for the rate.
5
Load P&L summary
Revenue, cost and margin at the required rate, in one view.
04 · Pricing Suite · Demo
Demo · Step 3 of 3 · Configure
Your trucks. Your costs. Your call.
1
Miles
Know the lane better? Override the modeled miles.
2
Times
Time-based cost reflects how the freight actually runs.
3
Costs
Adjust cost inputs and see exactly what they do to the rate.
4
Add stops
Multi-stop loads, priced honestly.
5
Reefer fuel burn
Temperature-controlled loads carry their true fuel cost.
04 · Pricing Suite · 01 SpotCheck
01 · SpotCheck · Roundtrip pricing
Roundtrips, now native.
Old wayWorkarounds to price both legs of a roundtrip.
New wayOne entry, both legs modeled, and one answer for the whole roundtrip.
04 · Pricing Suite · 01 SpotCheck
01 · SpotCheck · Three pricing targets
Three targets. Three different deals.
How SpotCheck has always priced
FM OR2
Core OR plus outbound. Inbound is excluded.
Inbound
Area
Core
The load
Outbound
Area
Use it for broker and one-off loads, where the truck is already in position.
New
Core OR
The load's standalone, one-way profitability.
Inbound
Area
Core
The load
Outbound
Area
Use it for a single lane on its own, such as one dedicated lane.
New
Full FM OR
Core OR plus inbound and outbound area economics.
Inbound
Area
Core
The load
Outbound
Area
Use it for a single lane that will be ongoing business, such as a one-lane bid.
04 · Pricing Suite · 01 SpotCheck
01 · SpotCheck · Costing detail and analytics
Know before you quote.
Detailed costing from MapLedger
Your costs, not a benchmark. Every cost assumption in the model, pulled from your MapLedger data and visible on the quote.
Expanded analytics
More than a rate. See where the load puts your truck and what that market looks like after delivery.
Old wayNavigate to MapLedger to see cost assumptions.
04 · Pricing Suite · 01 SpotCheck
01 · SpotCheck · The takeaway
Not just for broker loads anymore.
It now prices one-way, ongoing and roundtrip business, each against the target that fits.
One lane, on its own
Core OR
Ongoing business
Full FM OR
Broker and one-off
FM OR2
Out and back
Roundtrip
04 · Pricing Suite · 02 TripCheck
02 · TripCheck · Brand new
Price the whole trip.
Build the first order just like a SpotCheck and keep adding orders below it. You see the complete profitability of the trip.
1
Chicago, IL → Philadelphia, PA
Built like a SpotCheck
Load
2
Philadelphia, PA → Pittsburgh, PA
Reposition across the state
Deadhead
3
Pittsburgh, PA → Columbus, OH
Added below
Load
4
Columbus, OH → Chicago, IL
Back home. Trip complete.
Load
Trip profitability
From 1 leg entered
OR
Illustrative trip
04 · Pricing Suite · 02 TripCheck
02 · TripCheck · The key difference
TripCheck ignores the network. On purpose.
A trip is not influenced by your network's inbound or outbound profitability. TripCheck calculates solely from the orders in the scenario.
Not in TripCheck
Inbound area
Network economics
What TripCheck uses: only these orders
LoadCHI → PHL
→
DeadheadPHL → PIT
→
LoadPIT → CMH
→
LoadCMH → CHI
Not in TripCheck
Outbound area
Network economics
SpotCheckPrices a load inside your network, with area economics depending on the target you pick.
TripCheckPrices a trip on its own merits. What you enter is exactly what you get.
04 · Pricing Suite · Field guide
SpotCheck vs. TripCheck · Field guide
SpotCheck or TripCheck? One question.
Should the network influence this price?
Yes: SpotCheck. No, only these orders: TripCheck.
What you're pricing
Use
Why
A broker or one-off load
SpotCheck · FM OR2
The truck is in position; outbound still matters
A one-lane bid you'll run every week
SpotCheck · FM OR
Ongoing freight shapes both ends of the lane
A single lane on its own
SpotCheck · Core OR
Standalone, one-way profitability
Out and back on one lane
SpotCheck · Roundtrip
Both legs, one entry
Planning a driver's week
TripCheck
The whole week's profitability, from the orders entered
Modeling a proposed ongoing tour
TripCheck
Judge the tour on its own economics
Out-and-back pieces of the network
TripCheck
Isolate them from network area averages
04 · Pricing Suite · 03 Dedicated Pricing
03 · Dedicated Pricing · Dedicated Pricing Model
You already own a dedicated tool.
It's been free for a while, and most members have never opened it.
Simple by design: one screen to set your assumptions.
Cost it fast: price a straightforward dedicated opportunity without building a spreadsheet.
Free and included: like every tool in the suite, for every member.
Old wayA one-off spreadsheet, rebuilt for every dedicated opportunity.
04 · Pricing Suite · 03 Dedicated Pricing
03 · Dedicated Pricing · Advanced Dedicated Pricing Model
Built by an operator, for operators.
When a dedicated deal outgrows simple assumptions, the Advanced Dedicated Pricing Model fills the gap the other tools leave.
Brad Heisterkamp
Vice President, KSMTA. Former FreightMath client. 20+ years of truckload leadership at Ascend, NFI, Transco Lines and CRST.
TomorrowBrad opens Day Two at 8:00 AM with the full walkthrough.
04 · Pricing Suite
The FreightMath Pricing Suite
One suite. Every way you price freight.
Revamped
SpotCheck
One load or one lane, priced against the target that fits the deal: Core OR, FM OR or FM OR2. Roundtrips are native.
Best for broker and one-off loads, one-lane bids, single lanes and roundtrips
Brand new
TripCheck
Loads and deadhead strung into one trip, priced solely from the orders you enter.
Best for a driver's week, a proposed ongoing tour, and out-and-back pieces of the network
Expanded
Dedicated Pricing
The Dedicated Pricing Model for straightforward opportunities, plus the new Advanced Dedicated Pricing Model built by Brad Heisterkamp.
Best for dedicated opportunities, simple to complex
04 · Pricing Suite · Your move
Your move
It's live. It's yours. Run your own lane.
Live today
The full pricing suite
Free
Included for every member
No usage limits
Run as many as you want
No seat limits
Put your whole pricing team on it
1
Run your own example this week
Pick a lane you priced last month and see what the new SpotCheck says at app.freightmath.com.
SpotCheckRevamped. One-way, ongoing and roundtrip pricing.
TripCheckBrand new. Whole trips, priced on their own.
APIBeta, available now. Ask Jordan for access.
Adam Smith · Jordan Nelson · FreightMath
05 · AI Roundtable · Part 1
05
Tuesday · 3:00 PM · 60 minutes · Roundtable
How Carriers & FreightMath Are Using AI · Part 1
Facilitated by Chris Henry · every attendee is a participant
Since Spring: we asked everyone to start using an LLM for their own work. This is the report-back, in conversation. Nothing to present.
Round the room: at least ten specific use cases, named out loud.
Wins and concerns: where it saved real time, and where it fell short.
05 · AI Roundtable · Part 1 · Use cases
Round the room · at least ten specific use cases
Where AI shows up in a trucking company.
Samples to jog your memory. We want yours, named out loud and specific.
Pricing & quoting
Drafting spot quotes and rate checks
RFP and bid responses
Recalling what a customer last paid
Dispatch & operations
Load matching suggestions
Exception triage: late, detention, breakdown
Daily fuel buying and routing
Back office
Invoice and POD matching
AP and GL coding
Driver settlement checks
Safety & drivers
Coaching summaries from telematics
Incident and claim write-ups
Recruiting screening and outreach
Knowledge & admin
SOP libraries and institutional memory
Meeting notes turned into action items
Contract and policy questions
Agentic AI
Watch and flag: lane OR drift, a customer slipping
Run a workflow: RFP in, priced lanes out
Act with tool access, you approve
05 · AI Roundtable · Part 1 · Discussion
Discussion · the LLM challenge, six months on
Since Spring: what actually happened?
The win
Where has an LLM actually saved you time since Spring?
Personal tasks count. Email, research, drafting, summarizing. What did you stop doing by hand?
The surprise
What could it do that you didn't expect?
The task you thought it would fail at, and it didn't.
The concern
Where did it let you down, or worry you?
Wrong answers delivered confidently, or data you'd rather it hadn't seen.
The blocker
What's stopping you using it for real work?
Trust, data, time, policy, or nobody has asked you to?
Day One · Closing
Tuesday · 5:00 PM · Day One wrap
Day One: the platform, end to end.
Tonight · 6:00–8:00 PM
Culinary Dropout
1320 E 86th St, Indianapolis, IN 46240. Dinner and relationship building, sponsored by Tivitri.
Tomorrow · 7:00 AM
Breakfast · 3rd floor
Brad opens at 8:00 AM with Securing Profitable Dedicated Freight.
Homework
Run one SpotCheck tonight
Pick a lane you priced last month. Bring the result, and one AI idea, to tomorrow's session.
06 · Dedicated Pricing
06
Wednesday · 8:00 AM · 45 minutes
Advanced Dedicated Pricing Model
Brad Heisterkamp · Vice President, KSM Transport Advisors
Costing, modeling and contracting for the dedicated opportunities that don't fit the one-way network.
The tool: why dedicated plays by different rules.
A demo opportunity: what the customer told us, and where every input came from.
Live: cost it, model it, propose it and contract it, in one workflow.
06 · Dedicated Pricing · The tool
The tool
Built for dedicated. Not one-way.
Dedicated contract carriage plays by different rules. This is where those opportunities get costed, modeled, proposed and turned into a contract.
Dedicated contract carriage · what this tool is built for
Contractual and multi-year: priced once and run for years, not re-priced load by load.
Costing is often specific: the fleet and driver mix frequently differ from your existing business units.
Cost, model, propose, contract: one workflow, from start to signed agreement.
Stress-test and sandbox: flex the assumptions before committing capital.
Can stand alone: it often runs outside the day-to-day one-way network entirely.
For comparison · FreightMath
Activity-based costing for a lane, customer or the whole network
Built for one-way, segment-level business, rolled up to network OR
Supported by actual GL data, not a model of a hypothetical fleet
For comparison · BidRight
Focused on one-way freight. This tool is purpose-built for dedicated, which is a different pricing motion entirely.
06 · Dedicated Pricing · Demo opportunity
Demo opportunity · Heartland Foods Co. · Indianapolis, IN
What the customer told us.
A new dedicated fleet, with an RFP received and no asset-based incumbent today. Every dedicated opportunity starts as an intake conversation, not a spreadsheet.
8
Trucks requested
3 yr
Term requested
Q1 '27
Target go-live
Category
What they said
Volume
"We need consistent capacity out of our Indianapolis DC. Call it 8 trucks to start, with room to grow."
Equipment
"A mix of drop-and-hook dry van, plus a few reefers for the cold-chain SKUs."
Network
"Some of this is regional store-door delivery, some is just shuttling trailers between our DC and the cross-dock down the road."
Commercial
"We don't want one flat all-in rate. Break it into a fixed piece and a variable piece so we can see what's driving the number."
Term
"Looking for a three-year agreement, with an annual true-up."
06 · Dedicated Pricing · Inputs
Demo opportunity · 11 model inputs from 4 departments
Where the inputs came from.
6
Straight from the GL
5
Adjusted for this deal
Dept.
Input
Source
Detail
Sales
Volume & lane commitment
Adjusted
Built from the 8-truck ask. No comparable lane in the network today.
Sales
Rate expectation ceiling
Adjusted
Backed into from the customer's target linehaul budget.
Ops
Driver pay: regional
GL
Existing regional driver pay.
Ops
Driver pay: spot / day cab
GL
Existing spot driver pay bucket.
Ops
Deadhead % assumption
Adjusted
Shuttle runs modeled near-zero vs. the network average.
Ops
Fuel cost per mile
GL
Most recent GL month, network-wide average.
Recruiting
Cost per hire
GL
Standard recruiting cost bucket.
Recruiting
Time-to-staff ramp
Adjusted
New market for regional hires, so the ramp is stretched.
Finance
Insurance cost per mile
GL
Fleet-wide insurance rate.
Finance
Overhead per truck
GL
Standard per-truck overhead bucket.
Finance
New tractors / trailers
Adjusted
Current lease/purchase quotes, not existing book value.
06 · Dedicated Pricing · Live demo
Live demo
Let's build it live.
From these inputs to a cost build-up, a pricing sandbox and a customer-ready proposal, inside the Dedicated Model itself.
01
Cost
Build up the fleet, labor, fuel and overhead cost for Heartland Foods.
→
02
Model
Sandbox the fixed / variable blend and stress-test the assumptions.
→
03
Propose
Turn the model into a customer-facing rate proposal.
→
04
Contract
Generate the contract straight from the same numbers.
Facilitated by Chris Henry · every attendee is a participant
Past your own desk: who else is using it, and what you would hand over next.
Guardrails: what has to be true before AI touches a customer, a rate or driver data.
What you already have: the tools your people use today, approved or not.
07 · AI Roundtable · Part 2 · Discussion
Discussion · taking it past your own desk
From personal use to the business.
Spread
Who else in your company is using it, and for what?
Or are you still the only one?
The handoff
What would you hand to AI first if you trusted it?
The task you'd give up tomorrow, if it worked.
The guardrail
What has to be true before it touches a customer or a rate?
Review, limits, an audit trail. Who owns the miss?
The policy
Do you know what your people are already using?
Approved or not. And is any of it written down?
08 · Future of FreightMath
08
Wednesday · 10:45 AM · 75 minutes · Roundtable
Future of FreightMath
The FreightMath Team, with every member at the table
Seven roadmap topics, then the big one: connecting LLMs to your data. We bring the plan; you tell us what matters, what's missing and what to build first.
The roadmap: telematics, HOS normalization, FreightMath Actions, fuel, dedicated pricing, freight vs. ops, and the Control Room.
Deep discussion: from dashboards to conversation, with AI that can query your FreightMath data.
The vote: if we could only ship three, which three?
08 · Future of FreightMath · The roadmap
The roadmap at a glance
Eight topics. Your input sets the order.
01 · Precision
Telematics
Actual miles and hours replace inferred miles. Targeted for next year.
High lift
02 · Normalization
HOS normalization
Interpreted breaks out of productivity, plus reload potential beyond what the raw data shows.
Medium lift
03 · Action
FreightMath Actions
The key levers moving performance, with agreed items tracked to closure.
Medium lift
04 · Cost
Fuel cost
Lane- and segment-level fuel with a per-segment fuel index.
Medium lift
05 · Pricing
Dedicated wizard
From pricing model to a customer-ready contract.
Medium lift
06 · Diagnosis
Freight vs. ops
Pricing quality, separated from operational execution.
Medium lift
07 · Control
Control Room App
Broker/shipper, area control, trailer pools, strategic footprint and more.
High lift
08 · Deep discussion
LLMs on your data
Ask FreightMath a question in plain English and get an answer you can trust.
High lift
08 · Future of FreightMath · New ideas
New on the table · inside MapLedger
Five more, inside MapLedger.
Added for this meeting. Lift is our build estimate, not a commitment.
Transactions
Raw journal entries
Raw journal entries from your accounting platform, plus maintenance system data, down to the transaction.
High lift
Periods
Calendar month intervals
Report on true calendar months, not just rolling windows.
Low lift
Planning
Forecasting & budgeting
Build forecasts and budgets inside MapLedger.
Medium lift
Feedback loop
Forecast vs. actuals
Ongoing monthly reporting on forecast against actuals, to keep refining the forecast.
Medium lift
Benchmarks
Operating stats by operation
Operating statistics per operation, drawn from surveys and FreightMath data.
Medium lift
08 · Future of FreightMath · New ideas
New on the table · across the platform
And five more, across the platform.
All ten join the eight above in the vote.
Timing
Persistent processing
Real-time, instead of waiting on a weekly or daily run.
High lift
Decisions
Decision automation
Automated and optimized decisions, working with BidRight.
High lift
Scenarios
Hyper What If analysis
Model new awards, lost accounts or comp model changes, with BidRight.
High lift
Per unit
Driver & truck P&L
A detailed, actionable P&L for every driver and every truck.
Medium lift
Segments
Dedicated & non-OTR
Sharper profitability analysis for dedicated and other non-OTR business.
Medium lift
08 · Future of FreightMath · 01 Telematics
01 · Telematics · targeted for 2027
Replace inferred miles with actual miles.
What it is
Integrating telematics to capture actual miles, actual driving time and idle at the load and segment level, replacing TMS-derived estimates.
What changes for you
More precise hours mean more precise time-based cost. Segment-level OR becomes ground truth, and it's the foundation for fuel and HOS work.
Discuss
Which telematics providers should we integrate first?
Samsara, Motive, Omnitracs, Platform Science, PeopleNet: what's in your cab?
Discuss
Where are your TMS miles most wrong today?
Short haul, yard moves, out-of-route, detours. Where would actual miles change a decision?
Discuss
Would you share telematics data with FreightMath? What would you need first?
08 · Future of FreightMath · 02 HOS normalization
02 · HOS normalization · and reload potential
See what the raw data can't show.
What it is
HOS normalization removes interpreted 10-hour and 34-hour breaks from productivity, plus models that estimate reload potential in an area beyond what your own history shows.
What changes for you
Apples-to-apples comparisons across drivers, fleets and periods, and a forward-looking read on whether a destination will reload you.
Discuss
How do you explain a "bad week" today when it was really a reset?
Discuss
Would you trust a model that predicts reload potential in a market you've never run?
What evidence would it need to show you?
Discuss
Should peer (FreightMarks) data feed these predictions?
More data means better models. Where's the line?
08 · Future of FreightMath · 03 FreightMath Actions
03 · FreightMath Actions · report, notify, track
The platform tells you what to act on.
What it is
A holistic report and notification process that identifies the key levers moving your performance, across freight and cost, and tracks the items the group agreed to.
Where it's going
Adds P&L category callouts with peer context. The Autonomous Insight Agent delivers three to five decisions every Monday to email, Teams or mobile.
Discuss
How many action items is too many? Three a week? Ten?
Discuss
Who should get them: CEO, pricing, ops or a division manager?
Should each role see a different list?
Discuss
When you dismiss one, what should FreightMath learn from it?
08 · Future of FreightMath · 04 Fuel cost
04 · Fuel cost · lane- and segment-level
A per-segment fuel index.
What it is
Fuel costed where it's burned. A per-segment fuel index combines PADD and regional diesel pricing, IFTA differentials, tolls, loaded vs. empty burn, idle and MPG variance.
What changes for you
Far more geographically accurate cost: a Texas-to-California lane stops borrowing the network-average fuel price. It explains first, then optimizes.
Discuss
Where do you buy fuel today, and does your network know it?
Fuel network discounts, bulk on-site, cards. How should that flow into the index?
Discuss
Is your FSC program recovering fuel by lane, or only on average?
Discuss
Would a lane fuel optimizer change where you route or fuel?
The advanced dedicated pricing wizard plus a cafeteria-style contract generator: pick the terms (volume commitments, rate adjusters, exit provisions) and generate the document.
What changes for you
The guardrails Brad covered this morning become defaults, not things you remember to negotiate.
Discuss
Which contract term do you most often wish you'd included?
Discuss
Who signs off on a dedicated deal today, and what would they need to see?
Discuss
Should the generator support your own legal templates?
08 · Future of FreightMath · 06 Freight vs. ops
06 · Freight vs. ops
Was it the freight, or how we ran it?
What it is
Separating pricing quality from operational execution. Each lane reads as what actually happened against what could have happened under standard operations.
What changes for you
Sales and ops stop arguing over the same OR. A losing lane is either a pricing problem (fix the rate) or an execution problem (fix the operation).
Discuss
Who gets blamed for a bad lane in your shop, sales or ops?
Discuss
What does "standard operations" mean for your fleet?
Empty miles, dwell, utilization targets. Who should set the standard?
Discuss
Would you compensate pricing and ops on separate scores?
08 · Future of FreightMath · 07 Control Room
07 · The Control Room App
Your network logic, under your control.
What's in it
Broker / shipper classification
New area control: define your own markets
Trailer pools and pool membership
Strategic footprint: core vs. opportunistic lanes
Custom network logic and rules
Charges and more
Settings that need a ticket to the FreightMath Team today become self-service.
Discuss
Which setting would you change first if you had the controls today?
Discuss
Who on your team should be allowed to change network logic?
Should changes be versioned and approved?
Discuss
How do you define your "areas" today: zip3, KMA, custom?
08 · Future of FreightMath · 08 LLMs on your data
“
Show me my worst ten lanes by OR this quarter, and tell me which ones are a pricing problem.
08 · Deep discussion · Connecting LLMs to your data
08 · Future of FreightMath · 08 LLMs on your data
How it fits together
From dashboards to conversation.
1 · Your data
Sources
TMS orders & segments
GL via MapLedger
Driver pay
Telematics (2027)
→
2 · The model
FreightMath engine
Segment-level costing & OR
Glossary: one definition per metric
FreightMarks peer context
Row-level permissions
→
3 · The bridge
API + MCP connector
FreightMath API (in beta)
Governed, read-only tools
Audit log of every query
→
4 · The conversation
The LLM you choose
Conversational FreightMath in the web app
Your Claude or Copilot
Agents in Teams or Slack
The rule: the LLM asks the questions, and FreightMath does the math. Numbers come from the cost model, never generated by the language model.
08 · Future of FreightMath · 08 LLMs on your data
Three paths · not mutually exclusive
Where should the conversation live?
Path A · Inside FreightMath
Conversational FreightMath
A natural-language query layer in the new web app, targeted for Q1–Q2 2027.
Pro: zero setup, governed by default
Pro: knows the methodology and glossary
Con: only sees FreightMath data
Path B · Into your AI
FreightMath as a connector
An MCP connector and API so your Claude, Copilot or agents can call FreightMath alongside your TMS, email and files.
Pro: combines FreightMath with everything else you know
Pro: powers your own agents
Con: your governance, your model choice
Path C · Into your warehouse
Data feed
Segment-level cost and OR delivered to your Snowflake, Fabric or SQL, so you build on it.
Pro: total flexibility
Con: you own definitions, freshness and drift
Con: needs a data team
08 · Future of FreightMath · 08 LLMs on your data
Guardrails · what has to be true
Trust is the product. Five guardrails.
1
One definition
Every metric resolves to the FreightMath Glossary. "OR" means one thing.
2
Math by the model
The LLM calls tools. FreightMath computes, so no generated numbers.
3
Permissions
The AI sees only what the user could see: division, customer and role.
4
Show the work
Every answer links to the evidence: the page, the filter, the loads.
5
Your data stays yours
No training on member data. Enterprise model terms. An audit log of every query.
08 · Future of FreightMath · 08 LLMs on your data
Deep discussion · starters
Connecting LLMs to your data.
01 · The first question
What's the first question you'd ask FreightMath in plain English?
Write it down. We'll collect them; they become the test set.
02 · Path A, B or C
Do you want FreightMath inside your AI, or AI inside FreightMath?
Which AI platform has your company standardized on: Claude, Copilot, ChatGPT, none yet?
03 · Who asks
Who in your company would use it daily?
A CEO on mobile, a pricing analyst, a dispatcher? Different users need different guardrails.
04 · Trust
What would it take for you to act on an AI answer without opening a dashboard?
05 · Combining sources
What data would you want joined with FreightMath?
TMS live status, maintenance, safety, CRM, email with customers?
06 · Action
Should an agent ever act (reprice, decline a load) or only advise?
Where's your line, and who approves it?
08 · Future of FreightMath · The vote
The vote · click a tile to count hands (shift-click to undo)
Eighteen on the table. Which three ship first?
Telematics
High
0
HOS normalization & reload
Medium
0
FreightMath Actions
Medium
0
Lane & segment fuel index
Medium
0
Dedicated wizard & contracts
Medium
0
Freight vs. ops
Medium
0
Control Room App
High
0
LLMs on your data
High
0
Raw journal entries & maintenance
High
0
Persistent (real-time) processing
High
0
Calendar month intervals
Low
0
Decision automation with BidRight
High
0
Forecasting & budgeting in MapLedger
Medium
0
Hyper What If analysis
High
0
Driver & truck P&L
Medium
0
Dedicated & non-OTR profitability
Medium
0
Forecast vs. actuals
Medium
0
Operating stats by operation
Medium
0
Lift is our estimate. What's still missing?
08 · Future of FreightMath · Priority
The vote, turned into a sequence
Your votes. A first-cut order.
Ranked by hands raised, then sequenced by lift: low counts as one, medium two, high three, and each window holds four. Anything with no votes sits out.
A starting point for the conversation, not a commitment.
09 · AI Roundtable · Part 3
09
Wednesday · 1:30 PM · 60 minutes · Roundtable
How Carriers & FreightMath Are Using AI · Part 3
Facilitated by Chris Henry · every attendee is a participant
What you are taking home: the one thing you will actually try.
What we should build: your input, straight into the roadmap.
Spring 2027: you set the next challenge.
09 · AI Roundtable · Part 3 · Discussion
Discussion · closing the loop
What changes when you get home?
Taking home
What did you hear here that you'll actually try?
From another member, not from us.
Build this
What should FreightMath build for you first?
The one thing that would change a decision you make every week.
Still worried
What concern have we not addressed?
Say it now, while everyone is in the room.
Spring 2027
What should the next challenge be?
Theme, scope, how we report back. You set it.
10 · Closing
Key takeaways
Two days of FreightMath, in five lines.
1
The objective
Autonomous onboarding: more team time on your network, a deeper benchmark for all.
2
Precision
MapLedger and Segment-Level Costing: every dollar, every segment, tied to your GL.
3
Decisions
SpotCheck, TripCheck and Dedicated, live today, with no usage or seat limits.
4
AI
Trusted data first. Measure the return. Govern the data. One automation by Spring.
5
The roadmap
Your votes set the order. LLMs on your data, with FreightMath doing the math.
10 · Closing · Save the date
Save the date · FreightMath Alliance
Spring 2027
Dates and location to follow. Bring the automation you put in place, and the number that proves it worked.
Thank you
Thank you. Safe travels home.
Pricingapp.freightmath.com
Resourcesfreightmath.com/client
NewsFreightMath News, weekly
TeamYour KSMTA team
The FreightMath Team · KSM Transport Advisors · FreightMath, not Emotion.


 A Nussbaum Technology product · FreightMath built in


 app.freightmath.com


